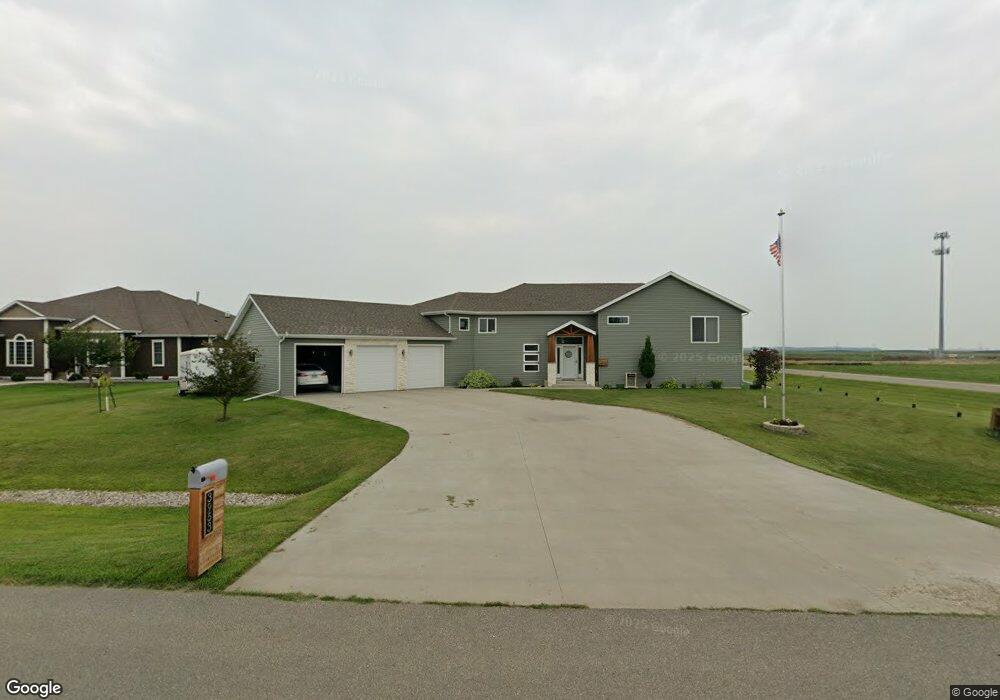
3953 14th St W West Fargo, ND 58078
Eagle Run NeighborhoodEstimated Value: $395,751 - $854,000
3
Beds
2
Baths
1,832
Sq Ft
$341/Sq Ft
Est. Value
About This Home
This home is located at 3953 14th St W, West Fargo, ND 58078 and is currently estimated at $624,876, approximately $341 per square foot. 3953 14th St W is a home with nearby schools including Aurora Elementary School, Liberty Middle School, and West Fargo Sheyenne High School.
Ownership History
Date
Name
Owned For
Owner Type
Purchase Details
Closed on
Nov 30, 2017
Sold by
Jordahl Custom Homes Inc
Bought by
Winkenwader Shane A and Winkenwader Monica D
Current Estimated Value
Home Financials for this Owner
Home Financials are based on the most recent Mortgage that was taken out on this home.
Original Mortgage
$196,000
Outstanding Balance
$162,520
Interest Rate
3.37%
Mortgage Type
Adjustable Rate Mortgage/ARM
Estimated Equity
$462,356
Purchase Details
Closed on
Aug 10, 2017
Sold by
Winkenwader Shane A and Winkenwader Monica
Bought by
Jordahl Custom Homes Inc
Purchase Details
Closed on
Apr 15, 2015
Sold by
Metro Flood Diversion Board Of Authority
Bought by
Winkenwader Shane A and Winkenwader Monica
Purchase Details
Closed on
Oct 5, 2011
Sold by
North Central Dakota Investments
Bought by
Cass County
Create a Home Valuation Report for This Property
The Home Valuation Report is an in-depth analysis detailing your home's value as well as a comparison with similar homes in the area
Home Values in the Area
Average Home Value in this Area
Purchase History
| Date | Buyer | Sale Price | Title Company |
|---|---|---|---|
| Winkenwader Shane A | $258,497 | Title Co | |
| Jordahl Custom Homes Inc | -- | Title Co | |
| Winkenwader Shane A | -- | None Available | |
| Cass County | -- | None Available |
Source: Public Records
Mortgage History
| Date | Status | Borrower | Loan Amount |
|---|---|---|---|
| Open | Winkenwader Shane A | $196,000 |
Source: Public Records
Tax History Compared to Growth
Tax History
| Year | Tax Paid | Tax Assessment Tax Assessment Total Assessment is a certain percentage of the fair market value that is determined by local assessors to be the total taxable value of land and additions on the property. | Land | Improvement |
|---|---|---|---|---|
| 2024 | $7,320 | $284,750 | $43,800 | $240,950 |
| 2023 | $7,407 | $268,450 | $43,800 | $224,650 |
| 2022 | $6,999 | $247,650 | $43,800 | $203,850 |
| 2021 | $6,637 | $230,900 | $32,850 | $198,050 |
| 2020 | $6,251 | $221,500 | $32,850 | $188,650 |
| 2019 | $3,121 | $105,250 | $32,850 | $72,400 |
| 2018 | $2,707 | $97,400 | $32,850 | $64,550 |
| 2017 | $4,247 | $23,000 | $23,000 | $0 |
| 2016 | $4,219 | $23,000 | $23,000 | $0 |
| 2015 | $4,055 | $0 | $0 | $0 |
| 2014 | $3,897 | $16,600 | $16,600 | $0 |
| 2013 | $4,034 | $0 | $0 | $0 |
Source: Public Records
Map
Nearby Homes
- 1236 S Beach Way
- 1156 42nd Ave W Unit A
- 1381 Westport Beach Way
- 1168 43rd Ave W
- 1040 39th Ave W
- 1054 42nd Ave W
- 909 38 1 2 Ave W
- 4509 11th St W
- 4507 Newport Ln
- 4717 11th St W
- 3662 N Sedona Ct
- 4534 Westport Pkwy
- 4757 11th St W
- 1097 Hickory Ln
- 1089 Hickory Ln
- 1082 Larkin Ln
- 1052 50th Ave W
- 974 50th Ave W
- 5102 11th St W
- 951 50th Ave W
- 3954 14th St W
- 3941 14th St W
- 3942 14th St W
- 3929 14 St W
- 3929 14th St W
- 3930 14 St W
- 3735 14th St W
- 3916 14th St W
- 3904 14th St W
- 3905 14th St W
- 3856 14th St W
- 3857 14th St W
- 3844 14th St W
- 3845 14th St W
- 3832 14th St W
- 1291 Diversion Dr
- 1297 Diversion Dr
- 3833 14th St W
- 1303 Diversion Dr
- 1309 Diversion Dr