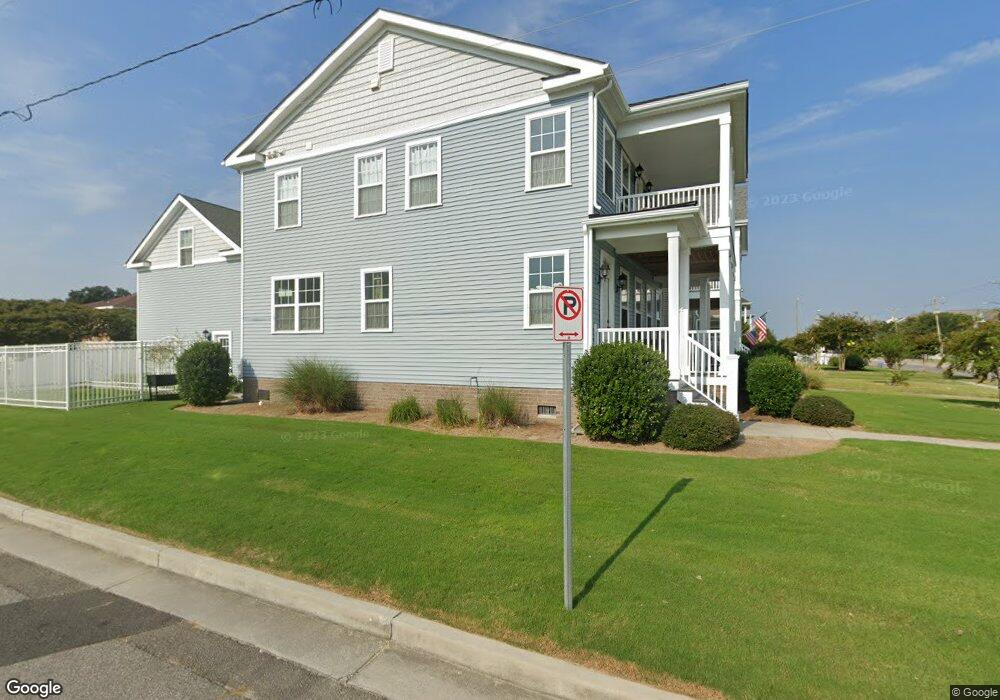
3953 E Ocean View Ave Norfolk, VA 23518
East Ocean View NeighborhoodEstimated Value: $691,502 - $775,000
4
Beds
3
Baths
2,579
Sq Ft
$279/Sq Ft
Est. Value
About This Home
This home is located at 3953 E Ocean View Ave, Norfolk, VA 23518 and is currently estimated at $720,126, approximately $279 per square foot. 3953 E Ocean View Ave is a home located in Norfolk City with nearby schools including Little Creek Elementary School, Azalea Gardens Middle School, and Lake Taylor High School.
Ownership History
Date
Name
Owned For
Owner Type
Purchase Details
Closed on
Jan 20, 2023
Sold by
Gram Scott W and Gram Tammy J
Bought by
Gram Living Trust
Current Estimated Value
Purchase Details
Closed on
Sep 18, 2017
Sold by
Richardson Homes Inc A Virginia Corporat
Bought by
Gram Scott W and Gram Tammy J
Home Financials for this Owner
Home Financials are based on the most recent Mortgage that was taken out on this home.
Original Mortgage
$339,920
Interest Rate
3.89%
Mortgage Type
New Conventional
Create a Home Valuation Report for This Property
The Home Valuation Report is an in-depth analysis detailing your home's value as well as a comparison with similar homes in the area
Home Values in the Area
Average Home Value in this Area
Purchase History
| Date | Buyer | Sale Price | Title Company |
|---|---|---|---|
| Gram Living Trust | -- | -- | |
| Gram Scott W | $424,900 | Attorney |
Source: Public Records
Mortgage History
| Date | Status | Borrower | Loan Amount |
|---|---|---|---|
| Previous Owner | Gram Scott W | $339,920 |
Source: Public Records
Tax History
| Year | Tax Paid | Tax Assessment Tax Assessment Total Assessment is a certain percentage of the fair market value that is determined by local assessors to be the total taxable value of land and additions on the property. | Land | Improvement |
|---|---|---|---|---|
| 2025 | $8,116 | $649,300 | $181,500 | $467,800 |
| 2024 | $7,664 | $623,100 | $173,000 | $450,100 |
| 2023 | $7,439 | $595,100 | $160,000 | $435,100 |
| 2022 | $6,499 | $519,900 | $124,000 | $395,900 |
| 2021 | $5,884 | $470,700 | $124,000 | $346,700 |
| 2020 | $5,520 | $441,600 | $108,000 | $333,600 |
| 2019 | $5,360 | $428,800 | $105,000 | $323,800 |
| 2018 | $5,123 | $409,800 | $96,000 | $313,800 |
| 2017 | $2,275 | $197,800 | $96,000 | $101,800 |
| 2016 | $1,104 | $0 | $0 | $0 |
| 2015 | -- | $0 | $0 | $0 |
Source: Public Records
Map
Nearby Homes
- 9633 20th Bay St
- 9612 20th Bay St
- 4007 Pleasant Ave
- 4019 Rugosa Rose Ct
- 9617 22nd Bay St
- 9570 21st Bay St
- 9719 21st Bay St
- 9556 21st Bay St
- 4152 E Beach Dr
- 3647 E Ocean View Ave
- 4210 E Beach Dr
- 9542 17th Bay St Unit A
- 9542 17th Bay St Unit B
- 9612 Nansemond Bay St
- 3811 Pretty Lake Ave
- 4300 Pleasant Ave
- 4310 Pleasant Ave
- 4320 Pleasant Ave
- 4330 Pleasant Ave
- 4340 Pleasant Ave
- 3945 E Ocean View Ave
- 3937 E Ocean View Ave
- 9633 20th Bay St Unit 6
- 9633 20th Bay St Unit 2
- 9633 20th Bay St Unit 4
- 9633 20th Bay St Unit 3
- 9633 20th Bay St Unit 1
- 3929 E Ocean View Ave
- 4015 E Ocean View Ave
- 9629 20th Bay St
- 3921 E Ocean View Ave
- 9626 20th Bay St
- 9624 20th Bay St
- 9625 20th Bay St
- 3913 E Ocean View Ave
- 4011 Rugosa Rose Ct
- 4048 E Ocean View Ave
- 3938 E Ocean View Ave
- 9622 20th Bay St
- 9632 19th Bay St
Your Personal Tour Guide
Ask me questions while you tour the home.