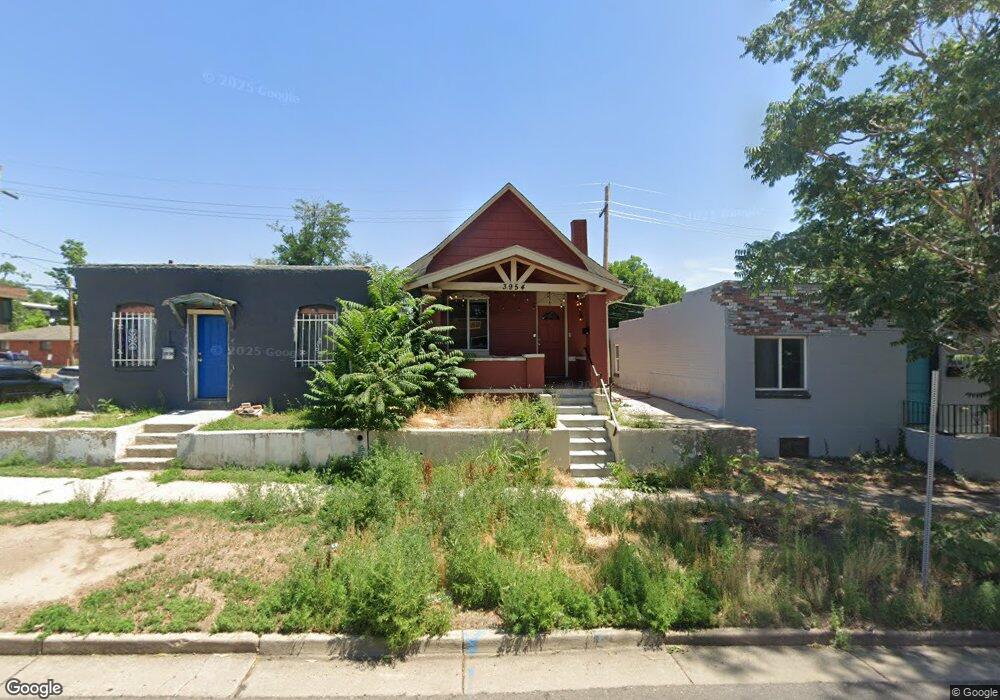
3954 Pecos St Denver, CO 80211
Sunnyside NeighborhoodEstimated Value: $420,000 - $460,000
1
Bed
1
Bath
922
Sq Ft
$476/Sq Ft
Est. Value
About This Home
This home is located at 3954 Pecos St, Denver, CO 80211 and is currently estimated at $438,815, approximately $475 per square foot. 3954 Pecos St is a home located in Denver County with nearby schools including Bryant Webster Dual Language School, Denver Montessori Junior/Senior High School, and Skinner Middle School.
Ownership History
Date
Name
Owned For
Owner Type
Purchase Details
Closed on
Dec 12, 2014
Sold by
Tedrow Investments Llc
Bought by
Mamuscia John and Mamuscia Courtney
Current Estimated Value
Home Financials for this Owner
Home Financials are based on the most recent Mortgage that was taken out on this home.
Original Mortgage
$161,250
Outstanding Balance
$51,784
Interest Rate
3.99%
Mortgage Type
New Conventional
Estimated Equity
$387,031
Purchase Details
Closed on
Aug 20, 2013
Sold by
Als Investments Colorado Llc
Bought by
Tedrow Investments Llc
Purchase Details
Closed on
Sep 16, 2011
Sold by
Equity Trust Company
Bought by
Als Invertments Llc
Purchase Details
Closed on
Aug 26, 2011
Sold by
Perez Anthony R and Perez Marlene J
Bought by
Equity Trust Company and Sverre Jensen Ira
Create a Home Valuation Report for This Property
The Home Valuation Report is an in-depth analysis detailing your home's value as well as a comparison with similar homes in the area
Home Values in the Area
Average Home Value in this Area
Purchase History
| Date | Buyer | Sale Price | Title Company |
|---|---|---|---|
| Mamuscia John | $215,000 | None Available | |
| Tedrow Investments Llc | -- | Heritage Title | |
| Als Invertments Llc | $72,500 | Fidelity National Title Insu | |
| Equity Trust Company | $7,000 | Fidelity National Title Insu | |
| Equity Trust Company | $3,500 | None Available | |
| Equity Trust Company | $3,500 | None Available |
Source: Public Records
Mortgage History
| Date | Status | Borrower | Loan Amount |
|---|---|---|---|
| Open | Mamuscia John | $161,250 |
Source: Public Records
Tax History
| Year | Tax Paid | Tax Assessment Tax Assessment Total Assessment is a certain percentage of the fair market value that is determined by local assessors to be the total taxable value of land and additions on the property. | Land | Improvement |
|---|---|---|---|---|
| 2025 | $1,952 | $34,640 | $9,940 | $9,940 |
| 2024 | $1,952 | $24,650 | $5,760 | $18,890 |
| 2023 | $1,910 | $24,650 | $5,760 | $18,890 |
| 2022 | $1,691 | $21,260 | $8,330 | $12,930 |
| 2021 | $1,632 | $21,870 | $8,570 | $13,300 |
| 2020 | $1,624 | $21,890 | $7,060 | $14,830 |
| 2019 | $1,579 | $21,890 | $7,060 | $14,830 |
| 2018 | $1,386 | $17,910 | $6,500 | $11,410 |
| 2017 | $1,381 | $17,910 | $6,500 | $11,410 |
| 2016 | $1,933 | $23,710 | $4,688 | $19,022 |
| 2015 | $1,434 | $18,350 | $4,688 | $13,662 |
| 2014 | $937 | $11,280 | $1,122 | $10,158 |
Source: Public Records
Map
Nearby Homes
- 3939 Osage St
- 3931 Osage St
- 3922 Osage St
- 4035 Osage St
- 4045 Osage St
- 3247 Navajo St
- 3829 Osage St
- 3835 Pecos St
- 4105 Navajo St
- 3960 Mariposa St
- 4059 Quivas St
- 1851 W 41st Ave
- 3935 Lipan St
- 4032 Lipan St
- 3935 Shoshone St
- 3929 Shoshone St
- 3700 Osage St
- 3718 Mariposa St
- 4227 Mariposa St
- 1201 W 41st Ave
Your Personal Tour Guide
Ask me questions while you tour the home.