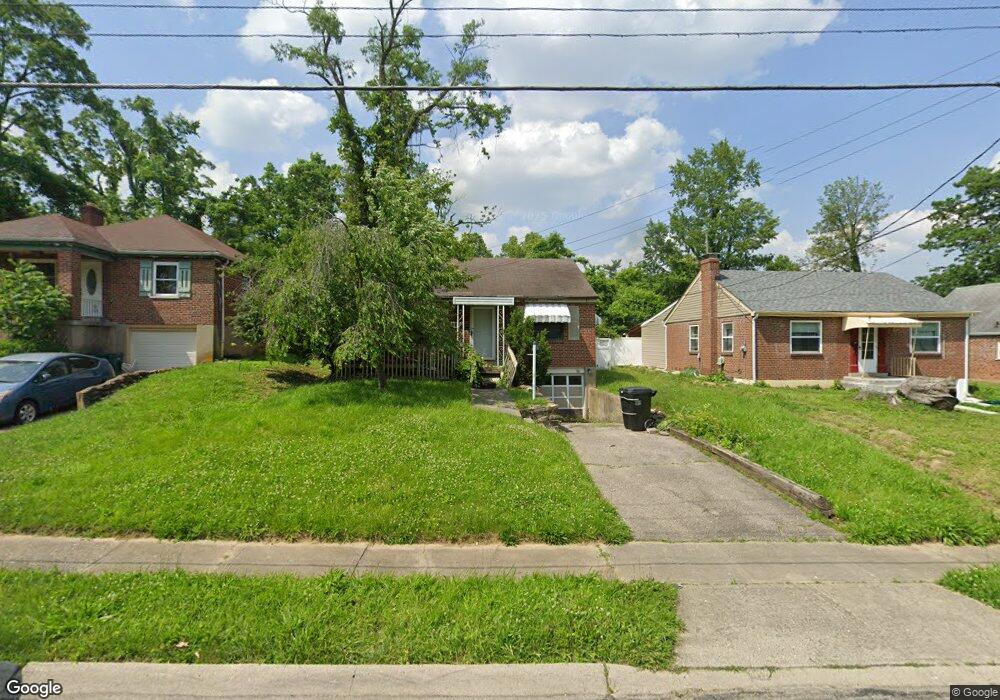
3954 Standish Ave Cincinnati, OH 45213
Kennedy Heights NeighborhoodEstimated Value: $136,000 - $174,000
2
Beds
1
Bath
783
Sq Ft
$202/Sq Ft
Est. Value
About This Home
This home is located at 3954 Standish Ave, Cincinnati, OH 45213 and is currently estimated at $158,517, approximately $202 per square foot. 3954 Standish Ave is a home located in Hamilton County with nearby schools including Silverton Paideia Elementary School, Shroder High School, and Clark Montessori High School.
Ownership History
Date
Name
Owned For
Owner Type
Purchase Details
Closed on
Apr 11, 2018
Sold by
Heath Frederick
Bought by
Heath Michael
Current Estimated Value
Purchase Details
Closed on
Dec 20, 2017
Sold by
Castle 2016 Llc
Bought by
Heather Frederick
Purchase Details
Closed on
May 4, 2016
Sold by
Bank Of New York Mellon
Bought by
Castle 2016 Llc
Purchase Details
Closed on
Nov 10, 2015
Sold by
Hamilton County Sheriff
Bought by
Bank Of New York Mellon
Purchase Details
Closed on
Apr 11, 1997
Sold by
Furlow Henry and Furlow Helen
Bought by
Gentry Anita L
Home Financials for this Owner
Home Financials are based on the most recent Mortgage that was taken out on this home.
Original Mortgage
$63,139
Interest Rate
7.74%
Create a Home Valuation Report for This Property
The Home Valuation Report is an in-depth analysis detailing your home's value as well as a comparison with similar homes in the area
Home Values in the Area
Average Home Value in this Area
Purchase History
| Date | Buyer | Sale Price | Title Company |
|---|---|---|---|
| Heath Michael | $5,000 | None Available | |
| Heather Frederick | $23,000 | None Available | |
| Castle 2016 Llc | $13,500 | -- | |
| Bank Of New York Mellon | $28,000 | -- | |
| Gentry Anita L | $63,000 | -- |
Source: Public Records
Mortgage History
| Date | Status | Borrower | Loan Amount |
|---|---|---|---|
| Previous Owner | Gentry Anita L | $63,139 |
Source: Public Records
Tax History
| Year | Tax Paid | Tax Assessment Tax Assessment Total Assessment is a certain percentage of the fair market value that is determined by local assessors to be the total taxable value of land and additions on the property. | Land | Improvement |
|---|---|---|---|---|
| 2025 | $2,221 | $34,850 | $10,395 | $24,455 |
| 2024 | $2,218 | $34,850 | $10,395 | $24,455 |
| 2023 | $2,221 | $34,850 | $10,395 | $24,455 |
| 2022 | $804 | $11,200 | $4,697 | $6,503 |
| 2021 | $786 | $11,200 | $4,697 | $6,503 |
| 2020 | $788 | $11,200 | $4,697 | $6,503 |
| 2019 | $865 | $11,200 | $4,158 | $7,042 |
| 2018 | $1,650 | $21,483 | $8,316 | $13,167 |
| 2017 | $1,589 | $21,483 | $8,316 | $13,167 |
| 2016 | $1,801 | $23,783 | $8,733 | $15,050 |
| 2015 | $1,611 | $23,783 | $8,733 | $15,050 |
| 2014 | $1,619 | $23,783 | $8,733 | $15,050 |
| 2013 | $1,569 | $22,649 | $8,316 | $14,333 |
Source: Public Records
Map
Nearby Homes
- 3964 Zinsle Ave
- 3906 Standish Ave
- 3962 S Fordham Place
- 3824 Standish Ave
- 3946 Cedarwood Place
- 6097 W Fordham Place
- 3765 Iona Ave
- 3921 Cedarwood Place
- 6656 Plainfield Rd
- 6705 Elwynne Dr
- 6207 Coleridge Ave
- 6508 Coleridge Ave
- 6501 Coleridge Ave
- 6829 Alpine Ave
- 6460 Mchugh Place
- 3625 Zinsle Ave
- 6218 Kennedy Ave
- 6201 Kennedy Ave
- 5635 Euclid Rd
- 3523 Mary Ann Ln
- 3958 Standish Ave
- 3950 Standish Ave
- 3962 Standish Ave
- 3946 Standish Ave
- 3945 Zinsle Ave
- 3966 Standish Ave
- 3947 Zinsle Ave
- 3943 Zinsle Ave
- 3941 Zinsle Ave
- 3941 Zinsle Ave Unit 4
- 3951 Zinsle Ave
- 3939 Zinsle Ave
- 3955 Standish Ave
- 3951 Standish Ave
- 3970 Standish Ave
- 3938 Standish Ave
- 3947 Standish Ave
- 3935 Zinsle Ave
- 3935 Zinsle Ave Unit 4
- 3963 Standish Ave
Your Personal Tour Guide
Ask me questions while you tour the home.