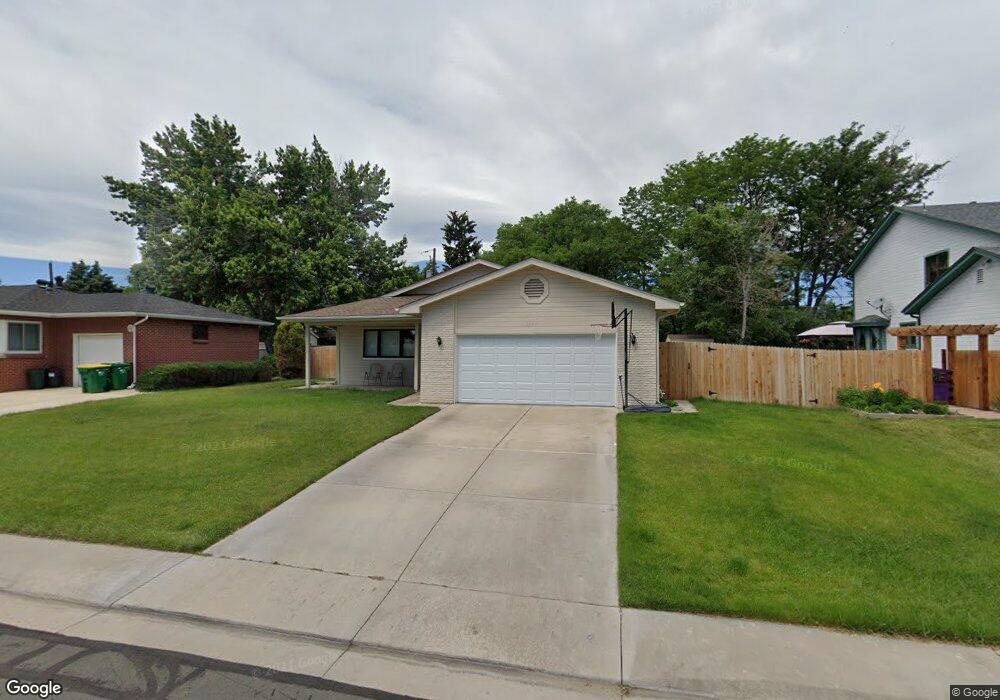
3955 Marshall St Wheat Ridge, CO 80033
Barths NeighborhoodEstimated Value: $635,000 - $752,000
3
Beds
3
Baths
1,626
Sq Ft
$418/Sq Ft
Est. Value
About This Home
This home is located at 3955 Marshall St, Wheat Ridge, CO 80033 and is currently estimated at $679,247, approximately $417 per square foot. 3955 Marshall St is a home located in Jefferson County with nearby schools including Stevens Elementary School, Everitt Middle School, and Wheat Ridge High School.
Ownership History
Date
Name
Owned For
Owner Type
Purchase Details
Closed on
Feb 6, 2006
Sold by
Deutsche Bank National Trust Co
Bought by
Milow Bradley B and Milow Carla E
Current Estimated Value
Home Financials for this Owner
Home Financials are based on the most recent Mortgage that was taken out on this home.
Original Mortgage
$100,000
Outstanding Balance
$55,962
Interest Rate
6.1%
Mortgage Type
Purchase Money Mortgage
Estimated Equity
$623,285
Purchase Details
Closed on
Jan 19, 2006
Sold by
Le Blanc Alphonse Benjamin
Bought by
Deutsche Bank National Trust Co and Ffmlt05-Ff2 Series 2005-Ff2
Home Financials for this Owner
Home Financials are based on the most recent Mortgage that was taken out on this home.
Original Mortgage
$100,000
Outstanding Balance
$55,962
Interest Rate
6.1%
Mortgage Type
Purchase Money Mortgage
Estimated Equity
$623,285
Purchase Details
Closed on
Feb 15, 2001
Sold by
Leblanc Alphonse Benjamin
Bought by
Leblanc Alphonse Benjamin
Create a Home Valuation Report for This Property
The Home Valuation Report is an in-depth analysis detailing your home's value as well as a comparison with similar homes in the area
Home Values in the Area
Average Home Value in this Area
Purchase History
| Date | Buyer | Sale Price | Title Company |
|---|---|---|---|
| Milow Bradley B | $235,000 | Fahtco | |
| Deutsche Bank National Trust Co | -- | None Available | |
| Leblanc Alphonse Benjamin | -- | -- |
Source: Public Records
Mortgage History
| Date | Status | Borrower | Loan Amount |
|---|---|---|---|
| Open | Milow Bradley B | $100,000 |
Source: Public Records
Tax History Compared to Growth
Tax History
| Year | Tax Paid | Tax Assessment Tax Assessment Total Assessment is a certain percentage of the fair market value that is determined by local assessors to be the total taxable value of land and additions on the property. | Land | Improvement |
|---|---|---|---|---|
| 2024 | $3,948 | $45,153 | $16,086 | $29,067 |
| 2023 | $3,948 | $45,153 | $16,086 | $29,067 |
| 2022 | $3,042 | $34,169 | $16,267 | $17,902 |
| 2021 | $3,084 | $35,152 | $16,735 | $18,417 |
| 2020 | $2,746 | $31,453 | $14,883 | $16,570 |
| 2019 | $2,709 | $31,453 | $14,883 | $16,570 |
| 2018 | $2,487 | $27,905 | $9,562 | $18,343 |
| 2017 | $2,245 | $27,905 | $9,562 | $18,343 |
| 2016 | $2,176 | $25,304 | $6,280 | $19,024 |
| 2015 | $1,806 | $25,304 | $6,280 | $19,024 |
| 2014 | $1,806 | $19,701 | $5,731 | $13,970 |
Source: Public Records
Map
Nearby Homes
- 3830 Otis St Unit 1-4
- 6455 W 38th Ave
- 3820 Pierce St
- 3830 Pierce St
- 6735 W 37th Place
- 4125 Pierce St
- 6145 W 38th Ave
- 4095 Quay St
- 3500 Otis St
- 5926 W 41st Ave Unit 10
- 4295 Harlan St
- 4014 Upham St
- 4045 Fenton Ct
- 4015 Fenton Ct
- 4008 Upham St
- 4026 Upham St
- 5904 W 37th Place
- 4020 Fenton Ct
- 4024 Upham St
- 7010 W 44th Ave
- 3945 Marshall St
- 3965 Marshall St
- 3890 Newland St
- 3925 Marshall St
- 3880 Newland St
- 3902 Newland St
- 3970 Marshall St
- 3960 Marshall St
- 3980 Marshall St
- 3870 Newland St
- 3910 Newland St
- 3865 Marshall St
- 3975 Marshall St
- 3930 Marshall St
- 3990 Marshall St
- 3860 Newland St
- 3920 Newland St
- 3855 Marshall St
- 3945 Lamar St
- 3895 Newland St