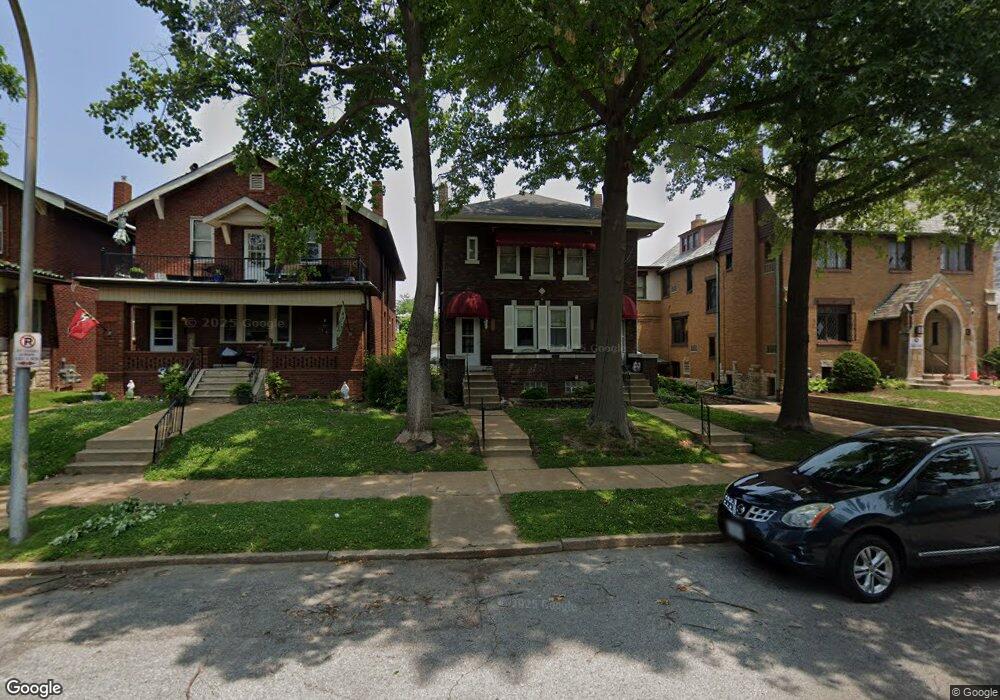
3955 Wilmington Ave Saint Louis, MO 63116
Holly Hills NeighborhoodEstimated Value: $223,000 - $297,000
--
Bed
2
Baths
2,300
Sq Ft
$118/Sq Ft
Est. Value
About This Home
This home is located at 3955 Wilmington Ave, Saint Louis, MO 63116 and is currently estimated at $271,257, approximately $117 per square foot. 3955 Wilmington Ave is a home located in St. Louis City with nearby schools including Woerner Elementary School, Long International Middle School, and Roosevelt High School.
Ownership History
Date
Name
Owned For
Owner Type
Purchase Details
Closed on
Jul 27, 2017
Sold by
Shoulders Michael J
Bought by
Finney Michael B and Finney Megan A
Current Estimated Value
Home Financials for this Owner
Home Financials are based on the most recent Mortgage that was taken out on this home.
Original Mortgage
$161,250
Outstanding Balance
$110,682
Interest Rate
3.91%
Mortgage Type
New Conventional
Estimated Equity
$160,575
Purchase Details
Closed on
Apr 30, 2004
Sold by
Forbes Virginia M
Bought by
Shoulders Michael J
Home Financials for this Owner
Home Financials are based on the most recent Mortgage that was taken out on this home.
Original Mortgage
$185,300
Interest Rate
6.25%
Mortgage Type
Purchase Money Mortgage
Purchase Details
Closed on
Jun 11, 1998
Sold by
Forbes Virginia M
Bought by
Forbes Virginia M and Virginia M Forbes Revocable Trust
Purchase Details
Closed on
Sep 26, 1997
Sold by
Mattingly Aubra L and Mattingly Emma L
Bought by
Forbes Virginia M
Home Financials for this Owner
Home Financials are based on the most recent Mortgage that was taken out on this home.
Original Mortgage
$74,000
Interest Rate
7%
Mortgage Type
Purchase Money Mortgage
Create a Home Valuation Report for This Property
The Home Valuation Report is an in-depth analysis detailing your home's value as well as a comparison with similar homes in the area
Home Values in the Area
Average Home Value in this Area
Purchase History
| Date | Buyer | Sale Price | Title Company |
|---|---|---|---|
| Finney Michael B | $215,000 | Ust | |
| Shoulders Michael J | -- | -- | |
| Forbes Virginia M | -- | -- | |
| Forbes Virginia M | -- | -- |
Source: Public Records
Mortgage History
| Date | Status | Borrower | Loan Amount |
|---|---|---|---|
| Open | Finney Michael B | $161,250 | |
| Closed | Shoulders Michael J | $185,300 | |
| Previous Owner | Forbes Virginia M | $74,000 | |
| Closed | Shoulders Michael J | $185,300 |
Source: Public Records
Tax History Compared to Growth
Tax History
| Year | Tax Paid | Tax Assessment Tax Assessment Total Assessment is a certain percentage of the fair market value that is determined by local assessors to be the total taxable value of land and additions on the property. | Land | Improvement |
|---|---|---|---|---|
| 2025 | $3,678 | $47,930 | $3,000 | $44,930 |
| 2024 | $3,511 | $40,760 | $3,000 | $37,760 |
| 2023 | $3,511 | $40,760 | $3,000 | $37,760 |
| 2022 | $3,301 | $36,710 | $3,000 | $33,710 |
| 2021 | $3,058 | $36,710 | $3,000 | $33,710 |
| 2020 | $2,831 | $34,220 | $3,000 | $31,220 |
| 2019 | $2,821 | $34,220 | $3,000 | $31,220 |
| 2018 | $2,433 | $28,560 | $2,660 | $25,900 |
| 2017 | $2,392 | $28,560 | $2,660 | $25,900 |
| 2016 | $2,299 | $27,090 | $2,660 | $24,430 |
| 2015 | $2,084 | $27,090 | $2,660 | $24,430 |
| 2014 | $2,021 | $27,090 | $2,660 | $24,430 |
| 2013 | -- | $26,280 | $2,660 | $23,620 |
Source: Public Records
Map
Nearby Homes
- 3922 Burgen Ave
- 5907 Leona St
- 4009 Burgen Ave
- 6116 Leona St
- 5632 Leona St
- 3824 Burgen Ave
- 3831 Burgen Ave
- 3839 Federer Place
- 5811 Dewey Ave
- 3953 Eiler St
- 6119 Newport Ave
- 3800 Wilmington Ave
- 4010 Schiller Place
- 4122 Federer St
- 3915 Schiller Place
- 4028 Schiller Place
- 6147 Adkins Ave
- 4226 Bates St
- 6146 Morganford Rd
- 3904 Walsh St
- 3959 Wilmington Ave
- 3963 Wilmington Ave
- 39633963A Wilmington Ave
- 3963 and 3963a Wilmington Ave
- 3967 Wilmington Ave
- 3954 Dover #2w Place
- 3954 Dover Unit 1w Place
- 3954 Dover #2e Place
- 3952 Dover Place
- 3948 Dover Place
- 3946 Dover Place
- 3954 Dover Place
- 3954 Dover Place Unit 1E
- 3954 Dover Place Unit 1E&1W
- 3954 Dover Place Unit 2E
- 3954 Dover Place Unit 1W
- 3954 Dover Place Unit 2W
- 3942 Dover Place
- 3950 Wilmington Ave
- 3958 Wilmington Ave