Estimated Value: $272,812 - $336,000
--
Bed
2
Baths
1,691
Sq Ft
$176/Sq Ft
Est. Value
About This Home
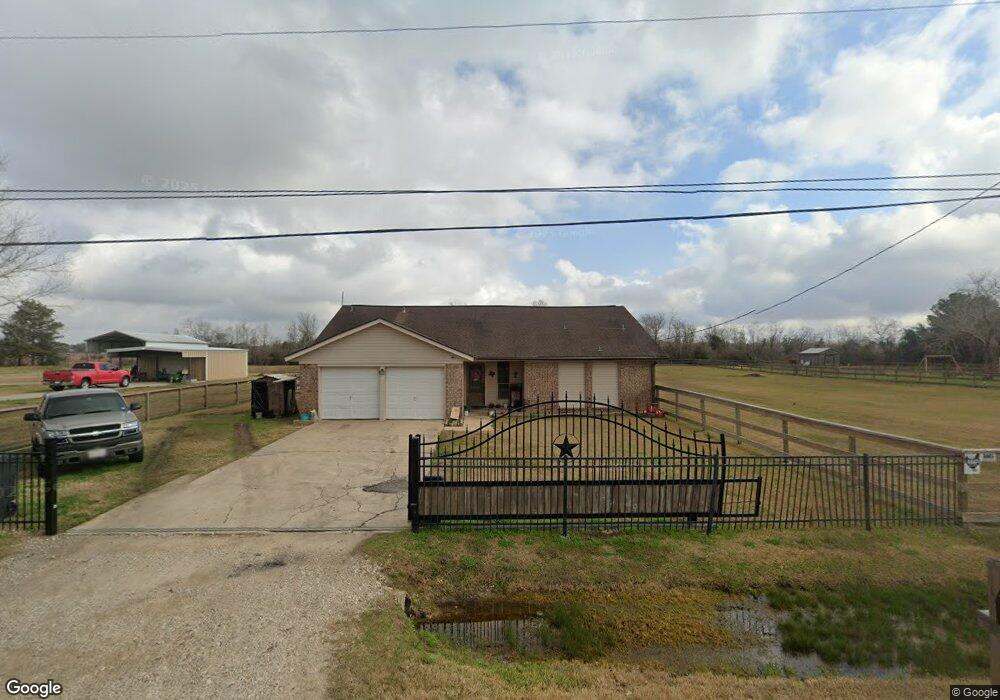
This home is located at 3956 County Road 962a, Alvin, TX 77511 and is currently estimated at $296,953, approximately $175 per square foot. 3956 County Road 962a is a home located in Brazoria County with nearby schools including Bob & Betty Nelson Elementary School, Fairview Junior High School, and Alvin High School.
Ownership History
Date
Name
Owned For
Owner Type
Purchase Details
Closed on
Mar 10, 2017
Sold by
Tassel Charles L Van and Tassel Sharon J Van
Bought by
Lang Rian Baylee and Lang Ashley Tenille
Current Estimated Value
Home Financials for this Owner
Home Financials are based on the most recent Mortgage that was taken out on this home.
Original Mortgage
$172,000
Outstanding Balance
$142,632
Interest Rate
4.17%
Mortgage Type
Purchase Money Mortgage
Estimated Equity
$154,321
Purchase Details
Closed on
Feb 24, 1997
Sold by
West William H and West Lillian D
Bought by
Hazley John G and Hazley Linda C
Home Financials for this Owner
Home Financials are based on the most recent Mortgage that was taken out on this home.
Original Mortgage
$9,100
Interest Rate
7.92%
Create a Home Valuation Report for This Property
The Home Valuation Report is an in-depth analysis detailing your home's value as well as a comparison with similar homes in the area
Home Values in the Area
Average Home Value in this Area
Purchase History
| Date | Buyer | Sale Price | Title Company |
|---|---|---|---|
| Lang Rian Baylee | -- | None Available | |
| Lang Rian Baylee | -- | None Available | |
| Hazley John G | -- | -- |
Source: Public Records
Mortgage History
| Date | Status | Borrower | Loan Amount |
|---|---|---|---|
| Open | Lang Rian Baylee | $172,000 | |
| Closed | Lang Rian Baylee | $172,000 | |
| Previous Owner | Hazley John G | $9,100 |
Source: Public Records
Tax History Compared to Growth
Tax History
| Year | Tax Paid | Tax Assessment Tax Assessment Total Assessment is a certain percentage of the fair market value that is determined by local assessors to be the total taxable value of land and additions on the property. | Land | Improvement |
|---|---|---|---|---|
| 2025 | $1,672 | $177,080 | $45,160 | $172,840 |
| 2023 | $1,672 | $146,347 | $31,450 | $224,260 |
| 2022 | $2,835 | $133,043 | $20,970 | $127,150 |
| 2021 | $2,684 | $145,000 | $29,170 | $115,830 |
| 2020 | $2,473 | $138,800 | $29,170 | $109,630 |
| 2019 | $2,314 | $121,440 | $21,880 | $99,560 |
| 2018 | $2,109 | $90,870 | $21,880 | $68,990 |
| 2017 | $2,135 | $90,870 | $21,880 | $68,990 |
| 2016 | $1,879 | $80,000 | $23,700 | $56,300 |
| 2014 | $1,664 | $70,320 | $18,230 | $52,090 |
Source: Public Records
Map
Nearby Homes
- 2703 County Road 962d
- 1682 Herring Rd
- 00 Davis Bend County Rd 179 Rd
- 000 Corner of County Road 180 and County Road 181 Rd
- 2016 W Davis Bend St
- 3293 County Road 181
- 1902 Westview Dr
- 0 Schroeder Lane B
- 2714 Westfield St
- 2693 Fairview Dr
- 2609 Adams St
- 2604 Adams St
- 2514 Westfield St
- 2386 Mamie Ford Rd
- 1916 Tracy Lynn Ln
- 3206 Deer Trail Dr
- 2609 Quail Run Dr
- 0 County Road 169 Off Nar
- 2306 Westfield St
- 10618 County Road 583b
- 3934 County Road 962a
- 3972 County Road 962a
- 3934 County Rd
- LT 52 County Road 962c
- Lot 76 County Road 962a
- 9 lots County Road 962a
- 3955 County Road 962a
- 3945 County Road 962a
- 3983 County Road 962a
- CR 962A Alvin
- 3975 County Road 962a
- 3990 County Road 962a
- 3916 County Road 962a
- 3916 Ray Dean St E Unit EAST
- 3929 County Road 962a
- 3991 County Road 962a
- 3908 County Road 962a
- 202 County Road 962a
- 3999 County Road 962a
- oo County Rd