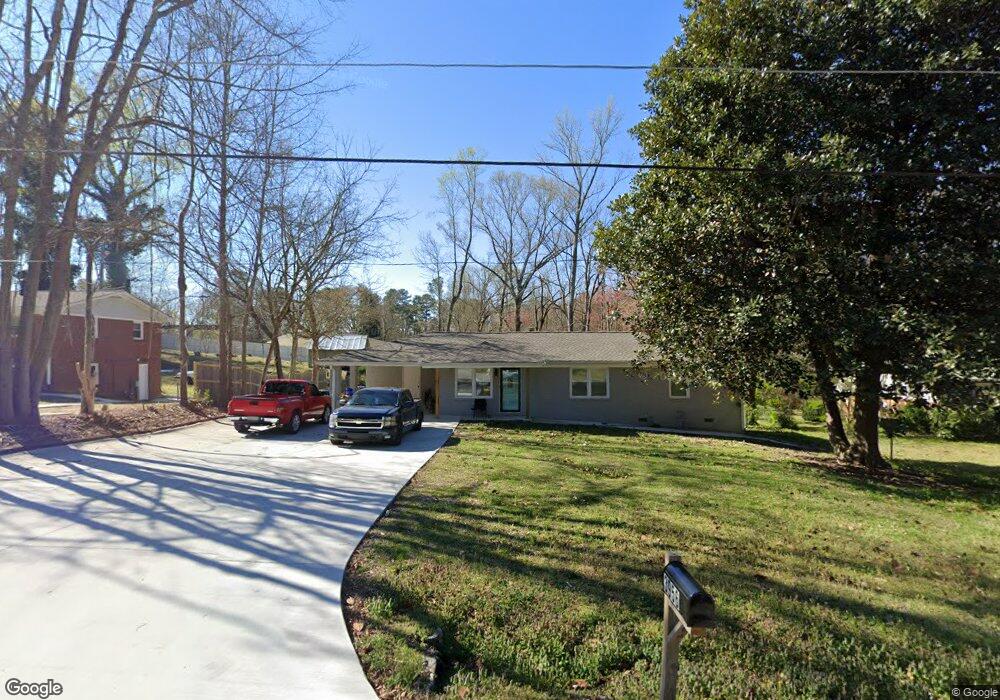
3956 Lithia Way Lithia Springs, GA 30122
Lithia Springs NeighborhoodEstimated Value: $222,373 - $259,000
2
Beds
2
Baths
1,125
Sq Ft
$208/Sq Ft
Est. Value
About This Home
This home is located at 3956 Lithia Way, Lithia Springs, GA 30122 and is currently estimated at $233,593, approximately $207 per square foot. 3956 Lithia Way is a home located in Douglas County with nearby schools including Lithia Springs Elementary School, Turner Middle School, and Lithia Springs Comprehensive High School.
Ownership History
Date
Name
Owned For
Owner Type
Purchase Details
Closed on
Jan 20, 2023
Sold by
Thompson Leigh Anne
Bought by
Padron Jose R and Rodriguez Maria F
Current Estimated Value
Purchase Details
Closed on
Sep 30, 1998
Sold by
Miller Rodney and Miller Christy
Bought by
Williamson Charles and Williamson Thompso
Home Financials for this Owner
Home Financials are based on the most recent Mortgage that was taken out on this home.
Original Mortgage
$78,850
Interest Rate
6.58%
Mortgage Type
FHA
Purchase Details
Closed on
Aug 26, 1994
Sold by
Mctaggart Vicki C
Bought by
Miller Rodney and Miller Christy
Home Financials for this Owner
Home Financials are based on the most recent Mortgage that was taken out on this home.
Original Mortgage
$60,700
Interest Rate
8.56%
Mortgage Type
FHA
Create a Home Valuation Report for This Property
The Home Valuation Report is an in-depth analysis detailing your home's value as well as a comparison with similar homes in the area
Home Values in the Area
Average Home Value in this Area
Purchase History
| Date | Buyer | Sale Price | Title Company |
|---|---|---|---|
| Padron Jose R | -- | -- | |
| Williamson Charles | $80,000 | -- | |
| Miller Rodney | $62,000 | -- |
Source: Public Records
Mortgage History
| Date | Status | Borrower | Loan Amount |
|---|---|---|---|
| Previous Owner | Williamson Charles | $78,850 | |
| Previous Owner | Miller Rodney | $60,700 |
Source: Public Records
Tax History Compared to Growth
Tax History
| Year | Tax Paid | Tax Assessment Tax Assessment Total Assessment is a certain percentage of the fair market value that is determined by local assessors to be the total taxable value of land and additions on the property. | Land | Improvement |
|---|---|---|---|---|
| 2024 | $2,614 | $83,080 | $14,000 | $69,080 |
| 2023 | $2,614 | $64,200 | $14,000 | $50,200 |
| 2022 | $1,084 | $41,080 | $8,000 | $33,080 |
| 2021 | $929 | $33,240 | $8,000 | $25,240 |
| 2020 | $947 | $33,240 | $8,000 | $25,240 |
| 2019 | $875 | $32,240 | $8,000 | $24,240 |
| 2018 | $866 | $31,600 | $8,000 | $23,600 |
| 2017 | $802 | $28,560 | $8,000 | $20,560 |
| 2016 | $729 | $25,920 | $7,440 | $18,480 |
| 2015 | $716 | $25,080 | $7,440 | $17,640 |
| 2014 | $692 | $23,960 | $7,440 | $16,520 |
| 2013 | -- | $23,680 | $7,440 | $16,240 |
Source: Public Records
Map
Nearby Homes
- 6906 Cherry Cir
- 0 Miller St Unit 10574225
- 3916 S Martin Way
- 6600 N Beulah Rd
- 7104 Miller St
- 6717 S Sweetwater Rd
- 4022 Creel Dr
- 540 Boulder Park Dr
- 7146 Old Beulah Rd
- 11041 Veterans Memorial Hwy
- 4365 Clare Ln
- 0 Mckown Rd Unit 7632191
- 0 Mckown Rd Unit 10583796
- 2500 Rosehill Cir
- 4336 Parkview Dr
- 6435 Joanna St
- 6538 N Sweetwater Rd
- 7011 S Sweetwater Rd
- 4485 Canary Ct
- 3946 Lithia Way
- 3974 Lithia Way
- 6919 Tammy Ln
- 3936 Lithia Way
- 3957 Lithia Way
- 3945 Lithia Way
- 3969 Lithia Way
- 3922 Lithia Way
- 3939 Lithia Way
- 3994 Lithia Way
- 3909 Lithia Way
- 6905 County Line Rd
- 6885 County Line Rd
- 6906 Kimberly Ln
- 6851 County Line Rd
- 6934 Tammy Ln
- 6920 Kimberly Ln
- 6839 County Line Rd
- 3997 Lithia Way
- 6931 County Line Rd