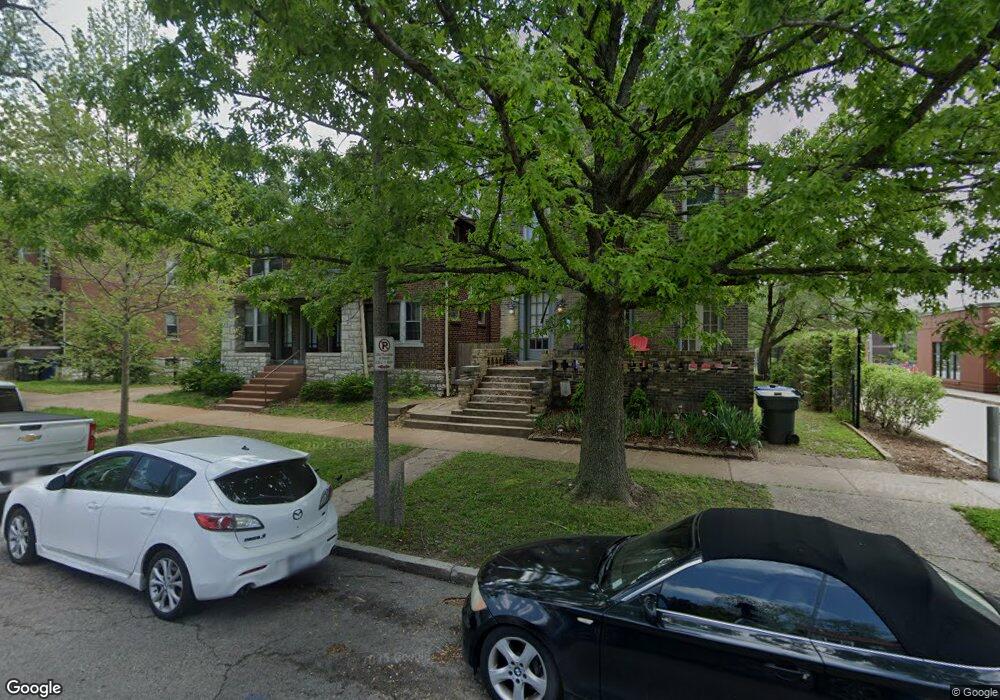
3956 Shaw Blvd Saint Louis, MO 63110
Shaw NeighborhoodEstimated Value: $408,066 - $460,000
--
Bed
2
Baths
2,388
Sq Ft
$181/Sq Ft
Est. Value
About This Home
This home is located at 3956 Shaw Blvd, Saint Louis, MO 63110 and is currently estimated at $431,267, approximately $180 per square foot. 3956 Shaw Blvd is a home located in St. Louis City with nearby schools including Adams Elementary School, Roosevelt High School, and City Garden Montessori Charter School.
Ownership History
Date
Name
Owned For
Owner Type
Purchase Details
Closed on
Jan 17, 2018
Sold by
County Of Saint Louis
Bought by
The Land Reutilization Authority Of The
Current Estimated Value
Purchase Details
Closed on
May 1, 2003
Sold by
Master Financial Inc
Bought by
Splater Scott A
Purchase Details
Closed on
Jan 10, 2003
Sold by
Asim Husan Jahi
Bought by
Master Financial Inc
Purchase Details
Closed on
Mar 26, 2002
Sold by
Kirby Elizabeth R and Leopold Jeff R
Bought by
Asim Husan Jahi
Home Financials for this Owner
Home Financials are based on the most recent Mortgage that was taken out on this home.
Original Mortgage
$119,850
Interest Rate
10.24%
Mortgage Type
Purchase Money Mortgage
Purchase Details
Closed on
Apr 7, 2000
Sold by
Folk Joseph N
Bought by
Kirby Elizabeth R and Leopold Jeff R
Home Financials for this Owner
Home Financials are based on the most recent Mortgage that was taken out on this home.
Original Mortgage
$63,957
Interest Rate
7.99%
Mortgage Type
FHA
Create a Home Valuation Report for This Property
The Home Valuation Report is an in-depth analysis detailing your home's value as well as a comparison with similar homes in the area
Home Values in the Area
Average Home Value in this Area
Purchase History
| Date | Buyer | Sale Price | Title Company |
|---|---|---|---|
| The Land Reutilization Authority Of The | -- | None Available | |
| Splater Scott A | -- | -- | |
| Master Financial Inc | $109,000 | -- | |
| Asim Husan Jahi | -- | Bankers Title Agency Inc | |
| Kirby Elizabeth R | -- | -- |
Source: Public Records
Mortgage History
| Date | Status | Borrower | Loan Amount |
|---|---|---|---|
| Previous Owner | Asim Husan Jahi | $119,850 | |
| Previous Owner | Kirby Elizabeth R | $63,957 |
Source: Public Records
Tax History Compared to Growth
Tax History
| Year | Tax Paid | Tax Assessment Tax Assessment Total Assessment is a certain percentage of the fair market value that is determined by local assessors to be the total taxable value of land and additions on the property. | Land | Improvement |
|---|---|---|---|---|
| 2025 | $4,903 | $64,340 | $2,740 | $61,600 |
| 2024 | $4,664 | $58,240 | $2,740 | $55,500 |
| 2023 | $4,664 | $58,240 | $2,740 | $55,500 |
| 2022 | $4,425 | $53,190 | $2,740 | $50,450 |
| 2021 | $4,418 | $53,190 | $2,740 | $50,450 |
| 2020 | $4,151 | $50,340 | $2,740 | $47,600 |
| 2019 | $4,136 | $50,340 | $2,740 | $47,600 |
| 2018 | $2,737 | $42,560 | $2,740 | $39,820 |
| 2017 | $2,690 | $32,170 | $2,740 | $29,430 |
| 2016 | $2,724 | $32,170 | $2,740 | $29,430 |
| 2015 | $2,470 | $32,170 | $2,740 | $29,430 |
| 2014 | $2,388 | $32,170 | $2,740 | $29,430 |
| 2013 | -- | $31,130 | $2,740 | $28,390 |
Source: Public Records
Map
Nearby Homes
- 3957 Shaw Blvd
- 4000 de Tonty St
- 4006 de Tonty St
- 4014 de Tonty St
- 3850 de Tonty St
- 3830 Shaw Blvd Unit A
- 3936 Mcree Ave
- 4051 Russell Blvd
- 1817 Thurman Ave
- 3671 Russell Blvd
- 4058 Blaine Ave
- 4139 Shaw Blvd
- 4011 Cleveland Ave
- 3822 Cleveland Ave
- 3630 Flad Ave
- 3912 Shenandoah Ave
- 4220 Castleman Ave
- 3612 Flad Ave
- 2211 S Grand Blvd Unit 302
- 2211 S Grand Blvd Unit 204
- 3952 Shaw Blvd
- 3948 Shaw Blvd
- 3949 Castleman Ave
- 3945 Castleman Ave
- 3940 Shaw Blvd
- 4000A Shaw Blvd
- 4000A Shaw Blvd
- 4000 Shaw Blvd
- 4000 Shaw Blvd
- 4000 Shaw Blvd Unit A
- 3938 Shaw Blvd
- 4001 Castleman Ave
- 3957 Shaw Blvd
- 3961 Shaw Blvd
- 3955 Shaw Blvd
- 3963 Shaw Blvd
- 3951 Shaw Blvd
- 3951 Shaw Blvd Unit 2F
- 3951 Shaw Blvd Unit 3rd Fl
- 3951 Shaw Blvd Unit 1st Fl