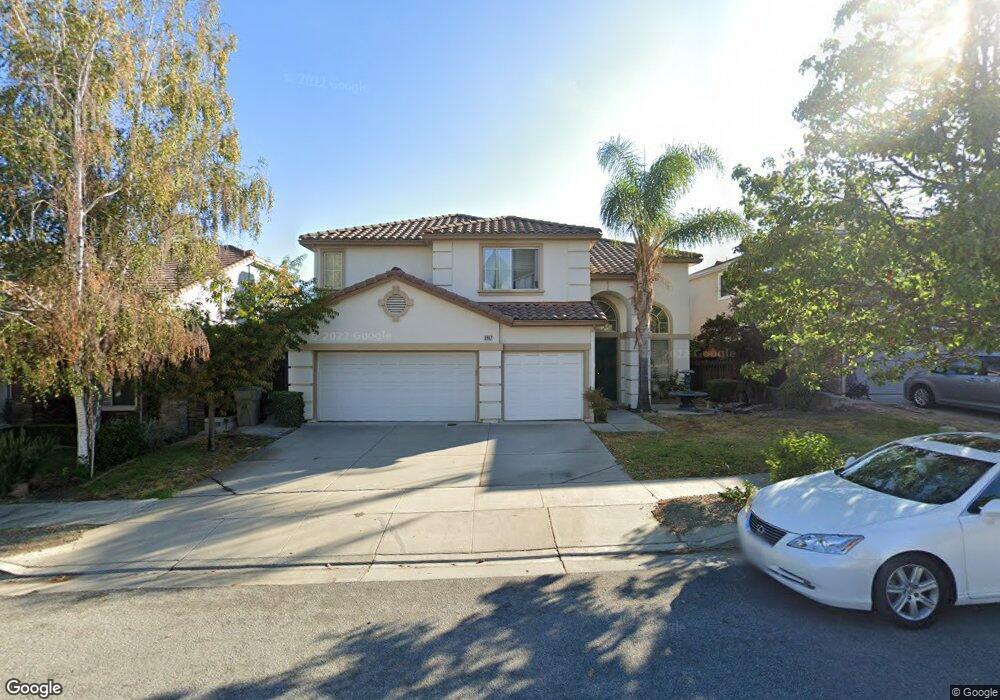
3957 Mars Ct San Jose, CA 95121
Silver Creek NeighborhoodEstimated Value: $2,047,000 - $2,526,627
About This Home
This home is located at 3957 Mars Ct, San Jose, CA 95121 and is currently estimated at $2,276,907, approximately $823 per square foot. 3957 Mars Ct is a home located in Santa Clara County with nearby schools including James Franklin Smith Elementary School, Chaboya Middle School, and Silver Creek High School.
Ownership History
We collect this data history from publicly available records. To have your information removed, we recommend requesting removal directly through your county’s website.
Purchase Details
Home Financials for this Owner
Home Financials are based on the most recent Mortgage that was taken out on this home.Purchase Details
Home Financials for this Owner
Home Financials are based on the most recent Mortgage that was taken out on this home.Purchase Details
Home Financials for this Owner
Home Financials are based on the most recent Mortgage that was taken out on this home.Home Values in the Area
Average Home Value in this Area
Purchase History
We collect this data history from publicly available records. To have your information removed, we recommend requesting removal directly through your county’s website.
| Date | Buyer | Sale Price | Title Company |
|---|---|---|---|
| -- | None Available | ||
| $1,165,000 | Alliance Title Company | ||
| $554,000 | First American Title Guarant |
Mortgage History
We collect this data history from publicly available records. To have your information removed, we recommend requesting removal directly through your county’s website.
| Date | Status | Borrower | Loan Amount |
|---|---|---|---|
| Open | $800,000 | ||
| Previous Owner | $443,000 |
Tax History
We collect this data history from publicly available records. To have your information removed, we recommend requesting removal directly through your county’s website.
| Year | Tax Paid | Tax Assessment Tax Assessment Total Assessment is a certain percentage of the fair market value that is determined by local assessors to be the total taxable value of land and additions on the property. | Land | Improvement |
|---|---|---|---|---|
| 2025 | $21,760 | $1,560,838 | $936,504 | $624,334 |
| 2024 | $21,760 | $1,530,235 | $918,142 | $612,093 |
| 2023 | $21,357 | $1,500,232 | $900,140 | $600,092 |
| 2022 | $21,199 | $1,470,817 | $882,491 | $588,326 |
| 2021 | $20,870 | $1,441,979 | $865,188 | $576,791 |
| 2020 | $19,982 | $1,427,194 | $856,317 | $570,877 |
| 2019 | $19,465 | $1,399,211 | $839,527 | $559,684 |
| 2018 | $19,305 | $1,371,776 | $823,066 | $548,710 |
| 2017 | $17,652 | $1,241,500 | $744,900 | $496,600 |
| 2016 | $15,847 | $1,139,000 | $683,400 | $455,600 |
| 2015 | $15,790 | $1,132,600 | $679,600 | $453,000 |
| 2014 | $14,619 | $1,089,000 | $653,400 | $435,600 |
Map
- 2854 Lowell Ct
- 4063 Cadwallader Ave
- 4199 Loganberry Dr
- 3767 Yerba Buena Ct
- 3550 Kettmann Rd
- 2652 Orinda Dr
- 2718 Millbrae Way
- 2616 Peartree Ln
- 2752 Millbrae Way
- 2715 Millbrae Way
- 000 Kettmann Rd
- 3808 Thompson Creek Ct
- 2538 Yerba Hills Ct
- 2561 Yerba Bank Ct
- 3350 Woodside Ln
- 2181 Laddie Ct
- 2611 Yerba Vista Ct
- 3341 Innerwick Ln
- 2660 Aborn Rd
- 1692 Ruther Place Ct
- 3963 Mars Ct
- 3951 Mars Ct
- 3925 Mars Ct
- 3950 Mars Ct
- 3956 Mars Ct
- 3915 Mars Ct
- 3938 Mars Ct
- 2207 Cirelli Dr
- 3920 Mars Ct
- 3909 Mars Ct
- 4450 Terra Brava Place
- 4456 Terra Brava Place
- 4444 Terra Brava Place
- 3916 Mars Ct
- 3903 Mars Ct
- 3932 Mars Ct
- 2210 Cirelli Dr
- 4462 Terra Brava Place
- 3926 Mars Ct
- 3908 Mars Ct
Ask me questions while you tour the home.