Estimated Value: $456,800 - $485,000
4
Beds
3
Baths
1,902
Sq Ft
$249/Sq Ft
Est. Value
About This Home
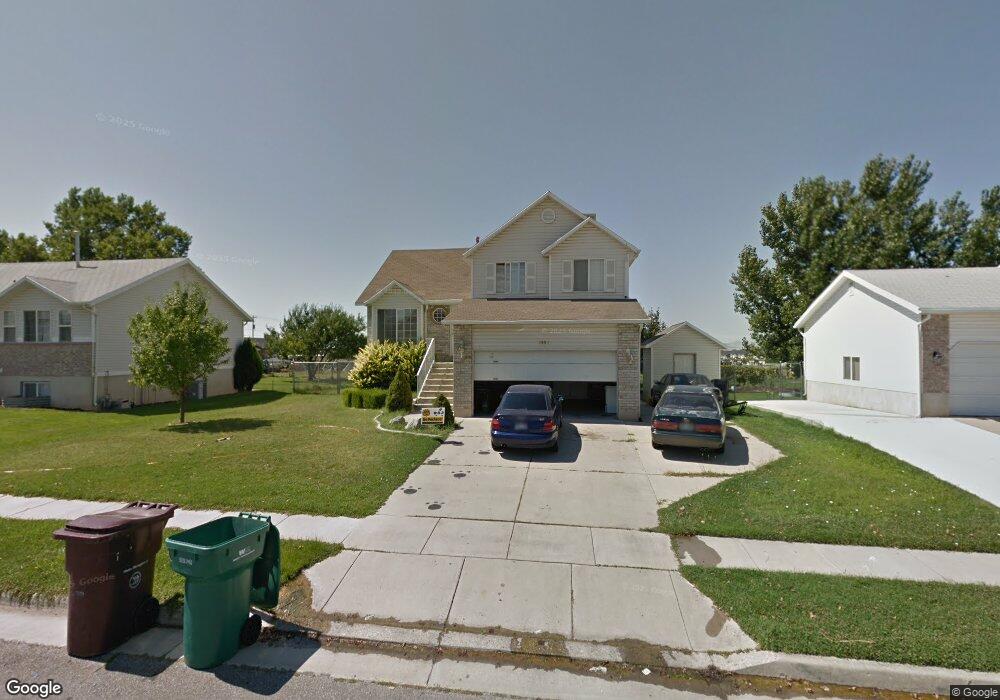
This home is located at 3957 S 2675 W, Roy, UT 84067 and is currently estimated at $473,450, approximately $248 per square foot. 3957 S 2675 W is a home located in Weber County with nearby schools including North Park School, Sand Ridge Junior High School, and Roy High School.
Ownership History
Date
Name
Owned For
Owner Type
Purchase Details
Closed on
Oct 14, 2014
Sold by
Jensen Lynette W
Bought by
Jensen Lynette W
Current Estimated Value
Purchase Details
Closed on
Oct 18, 2013
Sold by
Starkey James H and Starkey Janice C
Bought by
Jensen Lynette W
Purchase Details
Closed on
Sep 30, 2002
Sold by
Belnap Rodney D and Belnap Gina
Bought by
Starkey James H and Starkey Janice C
Purchase Details
Closed on
May 23, 1997
Sold by
Miller Stephen M
Bought by
Belnap Rodney and Belnap Gina
Home Financials for this Owner
Home Financials are based on the most recent Mortgage that was taken out on this home.
Original Mortgage
$80,990
Interest Rate
8.14%
Purchase Details
Closed on
Jan 1, 1997
Sold by
Prince Development Llc
Bought by
Miller Stephen M
Home Financials for this Owner
Home Financials are based on the most recent Mortgage that was taken out on this home.
Original Mortgage
$82,800
Interest Rate
7.74%
Mortgage Type
Construction
Create a Home Valuation Report for This Property
The Home Valuation Report is an in-depth analysis detailing your home's value as well as a comparison with similar homes in the area
Home Values in the Area
Average Home Value in this Area
Purchase History
| Date | Buyer | Sale Price | Title Company |
|---|---|---|---|
| Jensen Lynette W | -- | Founders Title Co | |
| Jensen Lynette W | -- | Founders Title Co Syracuse | |
| Starkey James H | -- | Associated Title | |
| Belnap Rodney | -- | Associated Title | |
| Miller Stephen M | -- | Associated Title |
Source: Public Records
Mortgage History
| Date | Status | Borrower | Loan Amount |
|---|---|---|---|
| Previous Owner | Belnap Rodney | $80,990 | |
| Previous Owner | Miller Stephen M | $82,800 |
Source: Public Records
Tax History
| Year | Tax Paid | Tax Assessment Tax Assessment Total Assessment is a certain percentage of the fair market value that is determined by local assessors to be the total taxable value of land and additions on the property. | Land | Improvement |
|---|---|---|---|---|
| 2025 | $2,842 | $454,506 | $140,308 | $314,198 |
| 2024 | $2,718 | $437,000 | $140,308 | $296,692 |
| 2023 | $2,414 | $385,000 | $132,063 | $252,937 |
| 2022 | $2,749 | $457,000 | $112,302 | $344,698 |
| 2021 | $2,143 | $320,000 | $77,323 | $242,677 |
| 2020 | $2,099 | $289,000 | $77,323 | $211,677 |
| 2019 | $2,093 | $272,000 | $51,830 | $220,170 |
| 2018 | $1,944 | $237,000 | $46,848 | $190,152 |
| 2017 | $1,792 | $204,000 | $44,899 | $159,101 |
| 2016 | $1,711 | $104,561 | $25,468 | $79,093 |
| 2015 | $1,536 | $95,602 | $25,468 | $70,134 |
| 2014 | $1,500 | $92,090 | $22,658 | $69,432 |
Source: Public Records
Map
Nearby Homes
- 4020 Westlake Dr
- 2782 W 4140 S Unit 249
- 2778 W 4175 S Unit 237
- 3973 S 2900 W Unit 9A
- 2579 W 3900 S
- 3922 S 2950 W
- 3931 S 2950 W
- 3750 S Midland Dr Unit 80
- 3750 S Midland Dr Unit 189
- 3750 S Midland Dr
- 3750 S Midland Dr Unit 34
- 2877 W 4200 S
- 2815 W 4275 S
- 2883 W 4275 S
- 3860 Midland Dr Unit C10
- 3860 Midland Dr Unit C39
- 3860 Midland Dr Unit A18
- 4275 S 2400 W
- 4374 S 2900 W
- 4046 Sandridge Dr Unit 2
Your Personal Tour Guide
Ask me questions while you tour the home.