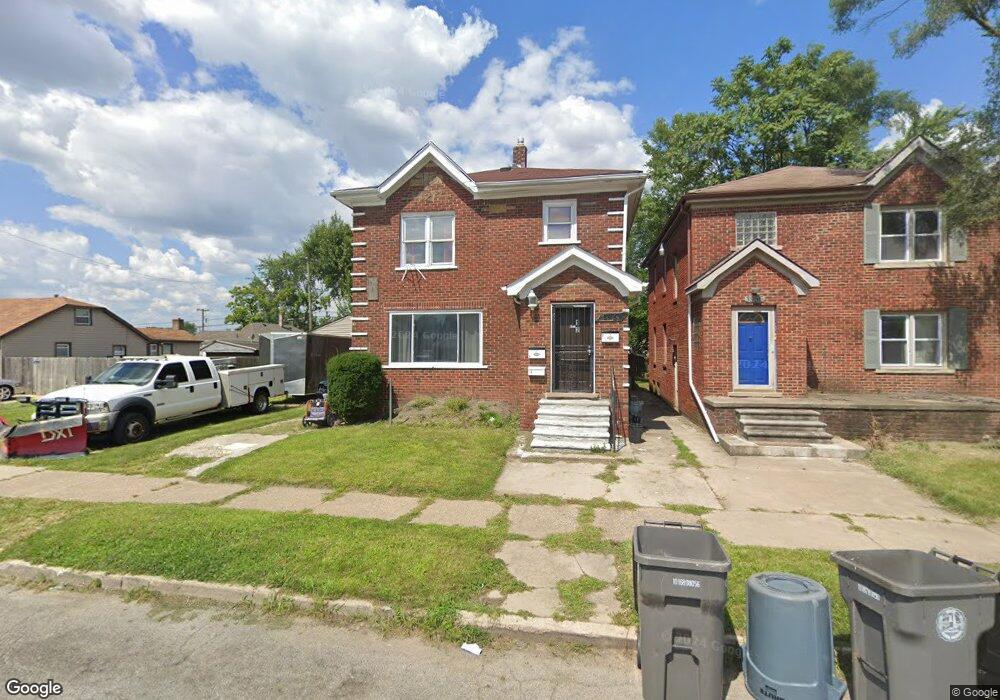
3958 12th St Ecorse, MI 48229
Estimated Value: $168,000 - $177,000
5
Beds
2
Baths
3,222
Sq Ft
$54/Sq Ft
Est. Value
About This Home
This home is located at 3958 12th St, Ecorse, MI 48229 and is currently estimated at $172,731, approximately $53 per square foot. 3958 12th St is a home located in Wayne County with nearby schools including Ralph J. Bunche Elementary, Grandport Academy, and Ecorse High School.
Ownership History
Date
Name
Owned For
Owner Type
Purchase Details
Closed on
Dec 29, 2012
Sold by
Zem Group International Inc
Bought by
3958 12Th Llc
Current Estimated Value
Purchase Details
Closed on
Nov 19, 2012
Sold by
Wayne County Treasurer
Bought by
Zem Group International Inc
Purchase Details
Closed on
Mar 15, 2011
Sold by
New Urban Housing Inc
Bought by
Sweeney John
Purchase Details
Closed on
Jan 21, 2010
Sold by
Anderton Andrew and Sweeney Jamie
Bought by
New Urban Housing Inc
Purchase Details
Closed on
Nov 25, 2009
Sold by
Lewis Mary
Bought by
Anderton Andrew
Purchase Details
Closed on
Jul 21, 2005
Sold by
Niezgoda George L
Bought by
Us Bank Na and Registered Holders Of Asset Backed Secur
Purchase Details
Closed on
Jul 1, 2004
Sold by
Findley Bernice Small and Small Bernice
Bought by
Niezgoda George L
Purchase Details
Closed on
Sep 18, 2003
Sold by
Finley Bernice Small
Bought by
Us Bank Na and Eqcc Home Equity Loan Trust 1998-2
Create a Home Valuation Report for This Property
The Home Valuation Report is an in-depth analysis detailing your home's value as well as a comparison with similar homes in the area
Home Values in the Area
Average Home Value in this Area
Purchase History
| Date | Buyer | Sale Price | Title Company |
|---|---|---|---|
| 3958 12Th Llc | $700 | None Available | |
| Zem Group International Inc | $700 | None Available | |
| Sweeney John | $1,000 | None Available | |
| New Urban Housing Inc | -- | None Available | |
| Anderton Andrew | $10,000 | Title One Inc | |
| Us Bank Na | $82,621 | -- | |
| Niezgoda George L | $90,000 | Commonwealth Land Title | |
| Us Bank Na | $39,836 | -- |
Source: Public Records
Tax History Compared to Growth
Tax History
| Year | Tax Paid | Tax Assessment Tax Assessment Total Assessment is a certain percentage of the fair market value that is determined by local assessors to be the total taxable value of land and additions on the property. | Land | Improvement |
|---|---|---|---|---|
| 2025 | $1,915 | $82,900 | $0 | $0 |
| 2024 | $1,915 | $72,800 | $0 | $0 |
| 2023 | $1,823 | $62,900 | $0 | $0 |
| 2022 | $3,516 | $50,900 | $0 | $0 |
| 2021 | $3,085 | $42,100 | $0 | $0 |
| 2019 | $2,986 | $30,400 | $0 | $0 |
| 2018 | $1,400 | $25,900 | $0 | $0 |
| 2017 | $3,033 | $26,300 | $0 | $0 |
| 2016 | $2,998 | $26,900 | $0 | $0 |
| 2013 | $5,370 | $55,100 | $0 | $0 |
| 2012 | $2,817 | $57,700 | $2,500 | $55,200 |
Source: Public Records
Map
Nearby Homes