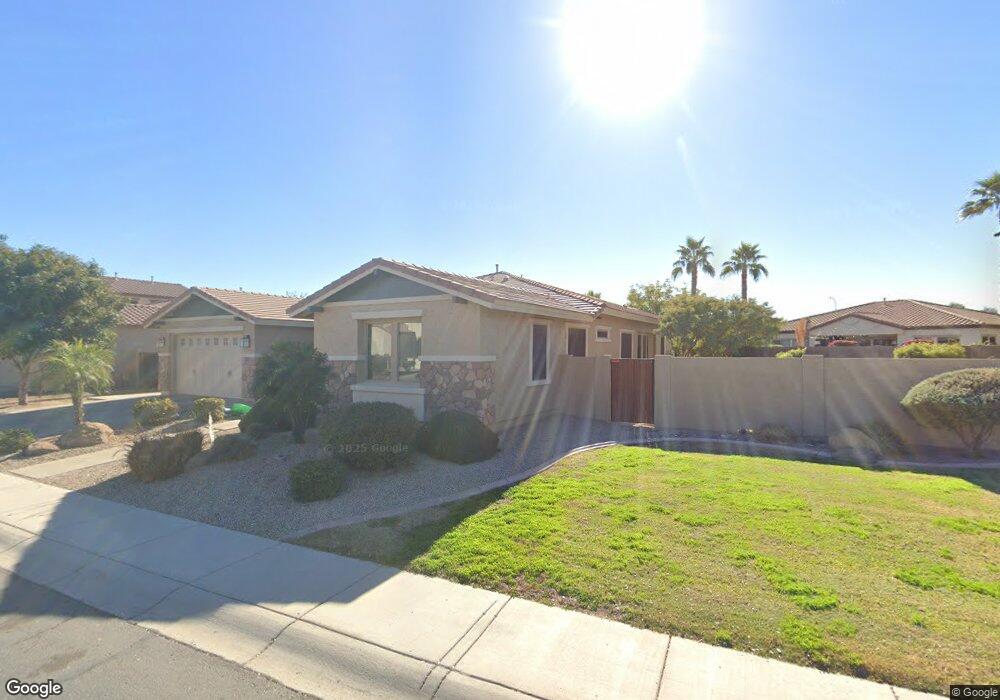
3959 E Kaibab Place Chandler, AZ 85249
South Chandler NeighborhoodEstimated Value: $868,031 - $1,234,000
4
Beds
3
Baths
2,921
Sq Ft
$344/Sq Ft
Est. Value
About This Home
This home is located at 3959 E Kaibab Place, Chandler, AZ 85249 and is currently estimated at $1,005,008, approximately $344 per square foot. 3959 E Kaibab Place is a home located in Maricopa County with nearby schools including Audrey & Robert Ryan Elementary School, Willie & Coy Payne Jr. High School, and Arizona College Prep Middle School.
Ownership History
Date
Name
Owned For
Owner Type
Purchase Details
Closed on
Mar 31, 2021
Sold by
Weinert Peter K and Weinert Lisa M
Bought by
Weinert Family Trust and Weinert
Current Estimated Value
Purchase Details
Closed on
Apr 22, 2011
Sold by
Cramer Keith and Cramer Teri
Bought by
Weinert Peter K and Weinert Lisa M
Home Financials for this Owner
Home Financials are based on the most recent Mortgage that was taken out on this home.
Original Mortgage
$250,000
Interest Rate
3.87%
Mortgage Type
New Conventional
Purchase Details
Closed on
Oct 15, 2007
Sold by
Shea Homes Arizona Lp
Bought by
Cramer Keith and Cramer Teri
Home Financials for this Owner
Home Financials are based on the most recent Mortgage that was taken out on this home.
Original Mortgage
$365,000
Interest Rate
6.3%
Mortgage Type
New Conventional
Create a Home Valuation Report for This Property
The Home Valuation Report is an in-depth analysis detailing your home's value as well as a comparison with similar homes in the area
Home Values in the Area
Average Home Value in this Area
Purchase History
| Date | Buyer | Sale Price | Title Company |
|---|---|---|---|
| Weinert Family Trust | -- | None Listed On Document | |
| Weinert Peter K | $377,000 | Stewart Title & Trust Of Pho | |
| Cramer Keith | $494,575 | First American Title Ins Co | |
| Shea Homes Arizona Lp | -- | First American Title Ins Co |
Source: Public Records
Mortgage History
| Date | Status | Borrower | Loan Amount |
|---|---|---|---|
| Previous Owner | Weinert Peter K | $250,000 | |
| Previous Owner | Cramer Keith | $365,000 |
Source: Public Records
Tax History Compared to Growth
Tax History
| Year | Tax Paid | Tax Assessment Tax Assessment Total Assessment is a certain percentage of the fair market value that is determined by local assessors to be the total taxable value of land and additions on the property. | Land | Improvement |
|---|---|---|---|---|
| 2025 | $4,287 | $51,474 | -- | -- |
| 2024 | $4,119 | $49,023 | -- | -- |
| 2023 | $4,119 | $64,620 | $12,920 | $51,700 |
| 2022 | $3,973 | $51,220 | $10,240 | $40,980 |
| 2021 | $4,086 | $47,630 | $9,520 | $38,110 |
| 2020 | $4,058 | $44,300 | $8,860 | $35,440 |
| 2019 | $3,896 | $41,060 | $8,210 | $32,850 |
| 2018 | $3,765 | $41,120 | $8,220 | $32,900 |
| 2017 | $3,504 | $38,570 | $7,710 | $30,860 |
| 2016 | $3,347 | $38,400 | $7,680 | $30,720 |
| 2015 | $3,204 | $36,110 | $7,220 | $28,890 |
Source: Public Records
Map
Nearby Homes
- 4390 S White Dr
- 4060 E Canyon Way
- 3618 E Kaibab Place
- 4080 E Canyon Way
- 4630 S Amethyst Dr
- 4216 E Prescott Place
- 4204 E Grand Canyon Dr
- 3690 E Canyon Way
- 3827 E Mead Dr
- 4414 E Glacier Place
- 3962 E Redwood Place
- 3445 E Grand Canyon Dr
- 3423 E Zion Way
- 1111 E Blue Spruce Ln
- 1224 E Tonto Dr
- 1244 E Prescott St
- 1278 E Prescott St
- 1246 E Penedes Dr
- 1254 E Penedes Dr
- 1274 E Plum St
- 3969 E Kaibab Place
- 3924 E Coconino Place
- 3944 E Coconino Place
- 3979 E Kaibab Place
- 3958 E Kaibab Place
- 3964 E Coconino Place
- 3968 E Kaibab Place
- 3900 E Sawtooth Dr
- 3974 E Coconino Place
- 3989 E Kaibab Place
- 3978 E Kaibab Place
- 3890 E Sawtooth Dr
- 3895 E Old Stone Cir S
- 3984 E Coconino Place
- 3988 E Kaibab Place
- 3999 E Kaibab Place
- 3880 E Sawtooth Dr
- 3890 E Old Stone Cir S
- 3943 E Coconino Place
- 3994 E Coconino Place