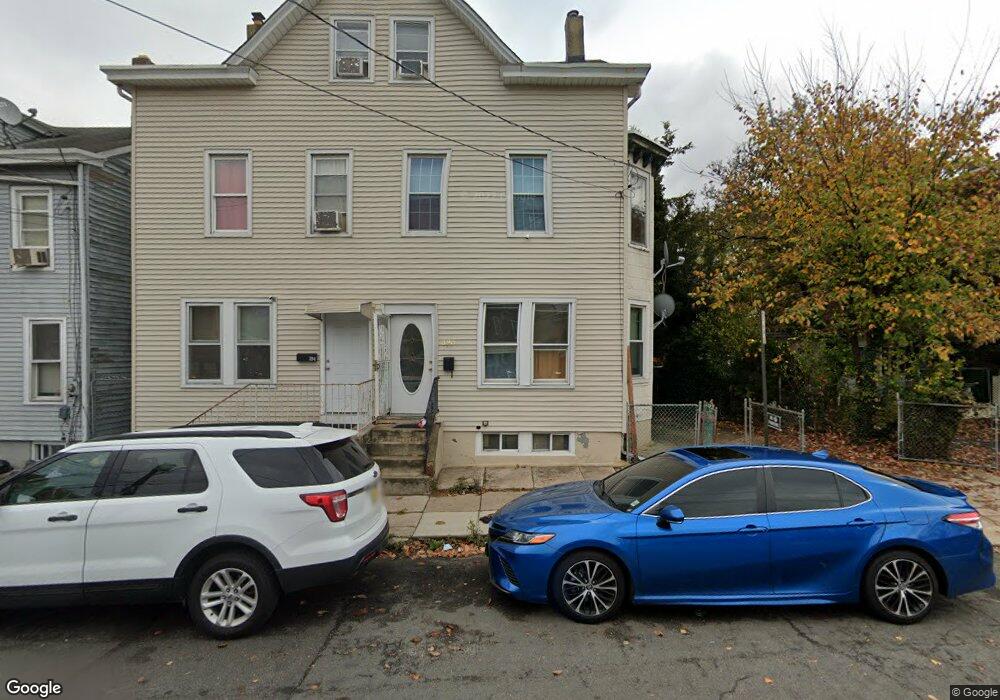
396 3rd St Trenton, NJ 08611
South Trenton NeighborhoodEstimated Value: $186,218 - $232,000
3
Beds
1
Bath
1,344
Sq Ft
$154/Sq Ft
Est. Value
About This Home
This home is located at 396 3rd St, Trenton, NJ 08611 and is currently estimated at $207,055, approximately $154 per square foot. 396 3rd St is a home located in Mercer County with nearby schools including Mott Elementary School, Parker Elementary School, and Grace A Dunn Middle School.
Ownership History
Date
Name
Owned For
Owner Type
Purchase Details
Closed on
Jul 19, 2021
Sold by
71 S Clinton Limited Liability Company
Bought by
Dershowitz Basyah M
Current Estimated Value
Home Financials for this Owner
Home Financials are based on the most recent Mortgage that was taken out on this home.
Original Mortgage
$67,500
Outstanding Balance
$61,302
Interest Rate
2.96%
Mortgage Type
New Conventional
Estimated Equity
$145,753
Purchase Details
Closed on
Jul 29, 2015
Sold by
Macwcp Iv Corp and Fishman Glen
Bought by
71 S Clinton Llc
Purchase Details
Closed on
Jun 3, 1999
Sold by
Skurla Edward
Bought by
Kamara Fatu
Home Financials for this Owner
Home Financials are based on the most recent Mortgage that was taken out on this home.
Original Mortgage
$31,697
Interest Rate
6.9%
Mortgage Type
FHA
Create a Home Valuation Report for This Property
The Home Valuation Report is an in-depth analysis detailing your home's value as well as a comparison with similar homes in the area
Home Values in the Area
Average Home Value in this Area
Purchase History
| Date | Buyer | Sale Price | Title Company |
|---|---|---|---|
| Dershowitz Basyah M | -- | Wellington Abstract Llc | |
| 71 S Clinton Llc | $5,833 | Successful Abstract | |
| Kamara Fatu | $32,000 | -- |
Source: Public Records
Mortgage History
| Date | Status | Borrower | Loan Amount |
|---|---|---|---|
| Open | Dershowitz Basyah M | $67,500 | |
| Previous Owner | Kamara Fatu | $31,697 |
Source: Public Records
Tax History Compared to Growth
Tax History
| Year | Tax Paid | Tax Assessment Tax Assessment Total Assessment is a certain percentage of the fair market value that is determined by local assessors to be the total taxable value of land and additions on the property. | Land | Improvement |
|---|---|---|---|---|
| 2025 | $3,370 | $58,100 | $8,100 | $50,000 |
| 2024 | $3,234 | $58,100 | $8,100 | $50,000 |
| 2023 | $3,234 | $58,100 | $8,100 | $50,000 |
| 2022 | $3,171 | $58,100 | $8,100 | $50,000 |
| 2021 | $3,226 | $58,100 | $8,100 | $50,000 |
| 2020 | $3,216 | $58,100 | $8,100 | $50,000 |
| 2019 | $3,164 | $58,100 | $8,100 | $50,000 |
| 2018 | $3,029 | $58,100 | $8,100 | $50,000 |
| 2017 | $2,879 | $58,100 | $8,100 | $50,000 |
| 2016 | $2,295 | $39,900 | $13,000 | $26,900 |
| 2015 | $2,287 | $39,900 | $13,000 | $26,900 |
| 2014 | $2,277 | $39,900 | $13,000 | $26,900 |
Source: Public Records
Map
Nearby Homes