396 Cove Blvd Dillon, CO 80435
Keystone NeighborhoodEstimated Value: $304,663 - $318,000
About This Home
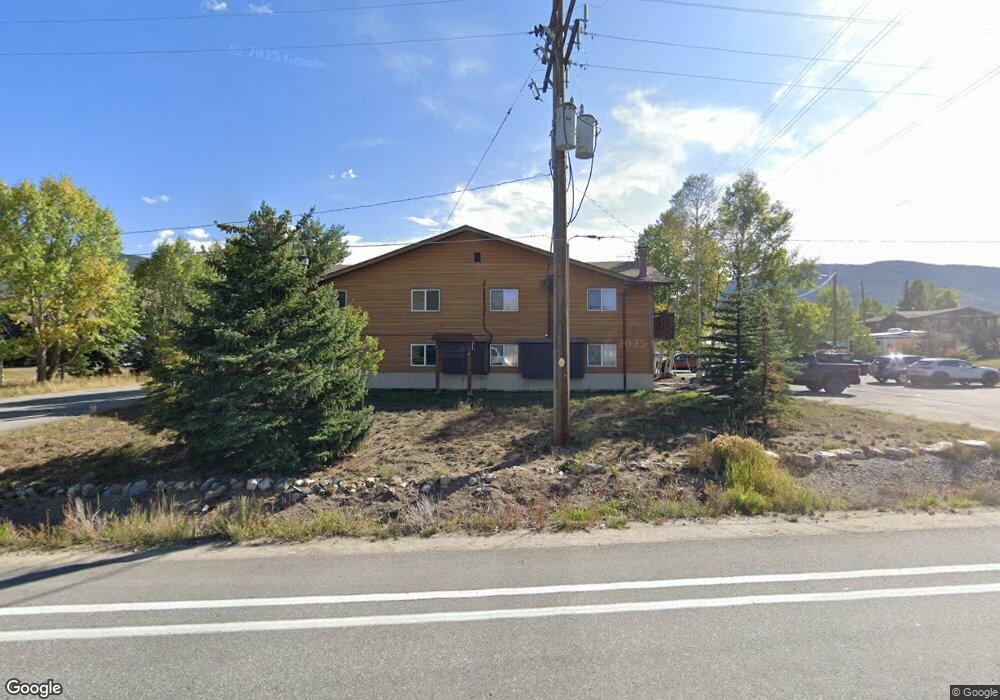
This home is located at 396 Cove Blvd, Dillon, CO 80435 and is currently estimated at $310,666, approximately $826 per square foot. 396 Cove Blvd is a home located in Summit County with nearby schools including Summit Cove Elementary School, Summit Middle School, and Summit High School.
Ownership History
We collect this data history from publicly available records. To have your information removed, we recommend requesting removal directly through your county’s website.
Purchase Details
Purchase Details
Purchase Details
Home Financials for this Owner
Home Financials are based on the most recent Mortgage that was taken out on this home.Purchase Details
Home Financials for this Owner
Home Financials are based on the most recent Mortgage that was taken out on this home.Home Values in the Area
Average Home Value in this Area
Purchase History
We collect this data history from publicly available records. To have your information removed, we recommend requesting removal directly through your county’s website.
| Date | Buyer | Sale Price | Title Company |
|---|---|---|---|
| -- | None Listed On Document | ||
| $212,000 | Land Title Guarantee Co | ||
| $149,900 | Stewart Title | ||
| $142,000 | Landamerica |
Mortgage History
We collect this data history from publicly available records. To have your information removed, we recommend requesting removal directly through your county’s website.
| Date | Status | Borrower | Loan Amount |
|---|---|---|---|
| Previous Owner | $112,425 | ||
| Previous Owner | $134,900 |
Tax History
We collect this data history from publicly available records. To have your information removed, we recommend requesting removal directly through your county’s website.
| Year | Tax Paid | Tax Assessment Tax Assessment Total Assessment is a certain percentage of the fair market value that is determined by local assessors to be the total taxable value of land and additions on the property. | Land | Improvement |
|---|---|---|---|---|
| 2024 | $1,132 | $24,877 | -- | $24,877 |
| 2023 | $1,181 | $21,192 | $0 | $0 |
| 2022 | $950 | $15,922 | $0 | $0 |
| 2021 | $958 | $16,381 | $0 | $0 |
| 2020 | $697 | $12,636 | $0 | $0 |
| 2019 | $688 | $12,636 | $0 | $0 |
| 2018 | $581 | $10,273 | $0 | $0 |
| 2017 | $535 | $10,273 | $0 | $0 |
| 2016 | $406 | $7,675 | $0 | $0 |
| 2015 | $394 | $7,675 | $0 | $0 |
| 2014 | $349 | $6,664 | $0 | $0 |
| 2013 | -- | $6,664 | $0 | $0 |
Map
- 258 Cove Blvd Unit 9
- 216 Climax Dr
- 250 Cove Blvd Unit 3
- 97 Sunlight Dr
- 148 Summit Dr Unit A7
- 58 Summit Dr Unit D9
- 14 Crystal Unit C14
- 36 Cove Blvd Unit G1
- 120 Gingerquill Ct
- 74 Doe Dr Unit 74
- 113 Soda Creek Ct
- 60 Doe Dr
- 1018 Summit Dr
- 27 Tally Ho Ct Unit 107
- 22 Sage View Ct Unit 1
- 22 Sage View Ct
- 631 Summit Dr
- 28 Maroon Peak Cir
- 105 River Course Dr Unit 9571
- 126 Snowberry Way
- 396 Cove Blvd Unit 26
- 396 Cove Blvd Unit 27
- 396 Cove Blvd Unit 2
- 396 Cove Blvd Unit 28
- 396 Cove Blvd Unit 17
- 396 Cove Blvd Unit 11
- 396 Cove Blvd Unit 23
- 396 Cove Blvd Unit 7
- 396 Cove Blvd Unit 31
- 396 Cove Blvd Unit 29
- 396 Cove Blvd Unit 18
- 396 Cove Blvd Unit 12
- 396 Cove Blvd Unit 14
- 396 Cove Blvd Unit 22
- 396 Cove Blvd Unit 20
- 396 Cove Blvd Unit 32
- 396 Cove Blvd Unit 4
- 396 Cove Blvd Unit 1
- 396 Cove Blvd Unit 19
- 396 Cove Blvd Unit 6
Ask me questions while you tour the home.