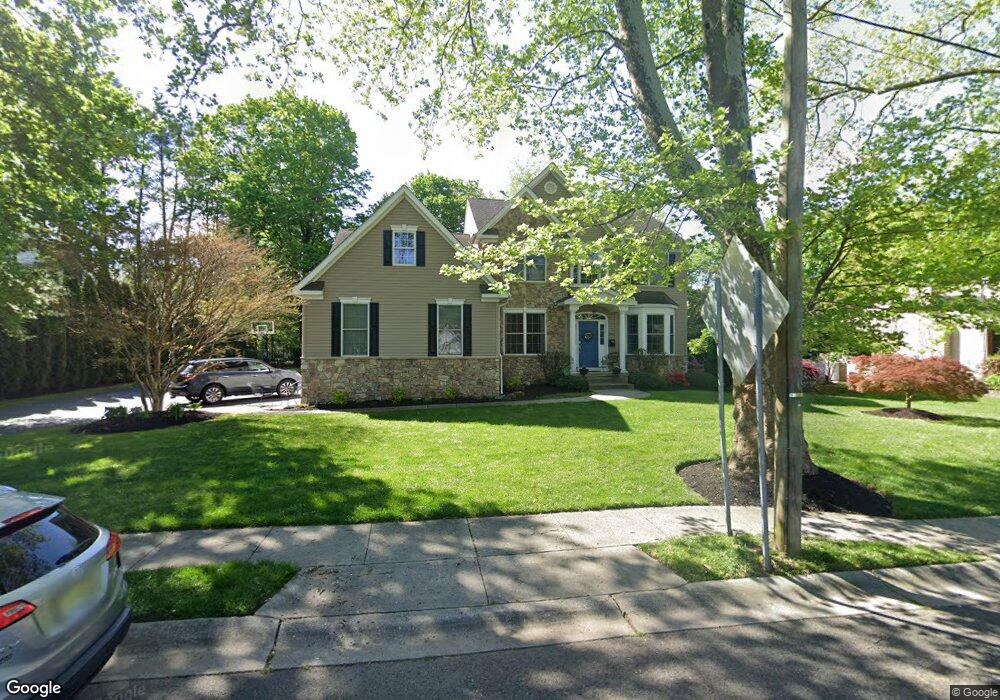
396 E 3rd St Moorestown, NJ 08057
Estimated Value: $975,232 - $1,021,000
4
Beds
3
Baths
3,180
Sq Ft
$312/Sq Ft
Est. Value
About This Home
This home is located at 396 E 3rd St, Moorestown, NJ 08057 and is currently estimated at $992,077, approximately $311 per square foot. 396 E 3rd St is a home located in Burlington County with nearby schools including South Valley Elementary School, Moorestown Upper Elementary School, and William Allen Middle School.
Ownership History
Date
Name
Owned For
Owner Type
Purchase Details
Closed on
Aug 19, 2011
Sold by
Angelo Joseph P and Angelo Marie A
Bought by
Kochuba Joseph and Kochuba Theresa
Current Estimated Value
Home Financials for this Owner
Home Financials are based on the most recent Mortgage that was taken out on this home.
Original Mortgage
$320,000
Outstanding Balance
$221,150
Interest Rate
4.53%
Mortgage Type
New Conventional
Estimated Equity
$770,927
Purchase Details
Closed on
Aug 1, 2006
Sold by
J & J Builders Inc
Bought by
Angelo Joseph P and Angelo Marie A
Purchase Details
Closed on
Dec 29, 2005
Sold by
Forbes Lance S
Bought by
J & J Builders Inc
Purchase Details
Closed on
Jun 27, 2000
Sold by
Dubois Jane E and Webster Claire
Bought by
Forbes Lance S
Create a Home Valuation Report for This Property
The Home Valuation Report is an in-depth analysis detailing your home's value as well as a comparison with similar homes in the area
Home Values in the Area
Average Home Value in this Area
Purchase History
| Date | Buyer | Sale Price | Title Company |
|---|---|---|---|
| Kochuba Joseph | $545,000 | None Available | |
| Angelo Joseph P | -- | None Available | |
| J & J Builders Inc | $247,500 | Surety Title Corp | |
| Forbes Lance S | -- | -- |
Source: Public Records
Mortgage History
| Date | Status | Borrower | Loan Amount |
|---|---|---|---|
| Open | Kochuba Joseph | $320,000 |
Source: Public Records
Tax History
| Year | Tax Paid | Tax Assessment Tax Assessment Total Assessment is a certain percentage of the fair market value that is determined by local assessors to be the total taxable value of land and additions on the property. | Land | Improvement |
|---|---|---|---|---|
| 2025 | $15,896 | $560,300 | $174,400 | $385,900 |
| 2024 | $15,414 | $560,300 | $174,400 | $385,900 |
| 2023 | $15,414 | $560,300 | $174,400 | $385,900 |
| 2022 | $15,257 | $560,300 | $174,400 | $385,900 |
| 2021 | $15,055 | $560,300 | $174,400 | $385,900 |
| 2020 | $14,960 | $560,300 | $174,400 | $385,900 |
| 2019 | $14,697 | $560,300 | $174,400 | $385,900 |
| 2018 | $14,299 | $560,300 | $174,400 | $385,900 |
| 2017 | $14,036 | $545,300 | $174,400 | $370,900 |
| 2016 | $13,987 | $545,300 | $174,400 | $370,900 |
| 2015 | $13,818 | $545,300 | $174,400 | $370,900 |
| 2014 | $13,120 | $545,300 | $174,400 | $370,900 |
Source: Public Records
Map
Nearby Homes
- 337 E 2nd St
- 325 E 2nd St
- 451 E 2nd St
- 408 N Stanwick Rd
- 308 Elm St
- 526 E Main St
- 437 Windrow Clusters Dr
- 205 E Central Ave
- 635 E Main St Unit 14
- 104 Mount Laurel Rd
- 127 Schooley St
- 133 Plum St Unit 6
- 80 E 3rd St
- 66 E 3rd St
- 744 Signal Light Rd
- 228 Mill St
- 863 Golf View Rd
- 120 Canterbury Rd
- 700 Lippincott Ave
- 129 S Church St
Your Personal Tour Guide
Ask me questions while you tour the home.