Estimated Value: $303,000 - $348,000
3
Beds
1
Bath
1,962
Sq Ft
$164/Sq Ft
Est. Value
About This Home
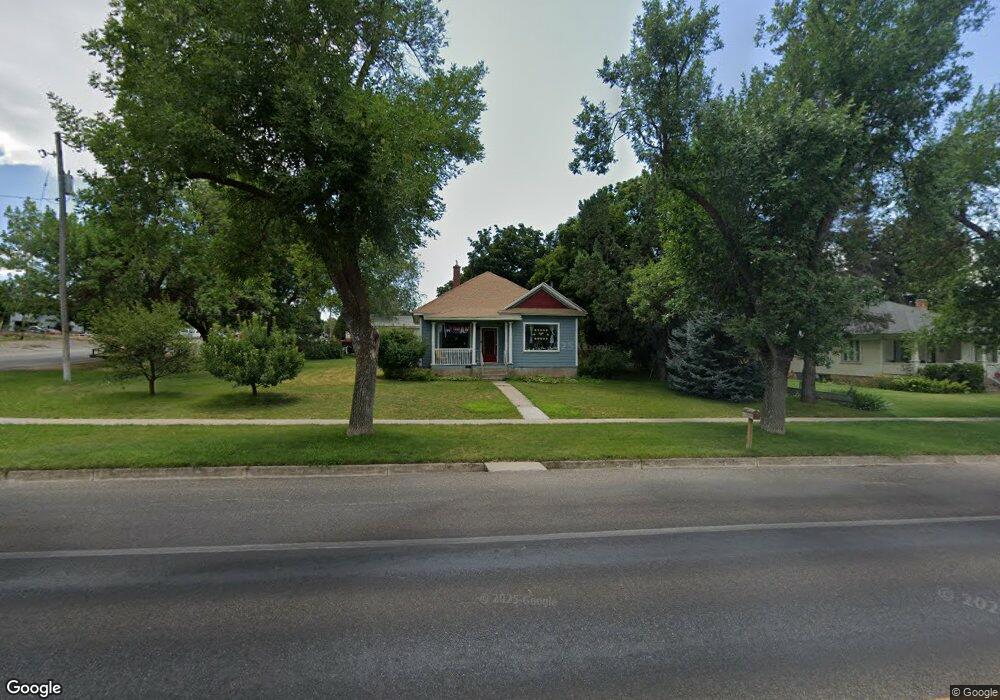
This home is located at 396 E Main St, Hyrum, UT 84319 and is currently estimated at $321,716, approximately $163 per square foot. 396 E Main St is a home located in Cache County with nearby schools including Lincoln School, South Cache Middle School, and Mountain Crest High School.
Ownership History
Date
Name
Owned For
Owner Type
Purchase Details
Closed on
May 26, 2022
Sold by
Janis Lynn Cavanagh Living Trust
Bought by
Frank J A
Current Estimated Value
Purchase Details
Closed on
Dec 17, 2010
Sold by
Cavanagh Janis and Mcguire Jennifer L
Bought by
The Janis Lyn Cavanagh Living Trust
Purchase Details
Closed on
Mar 31, 2010
Sold by
Mcguire Marc L
Bought by
Cavanagh Janis and Mcguire Jennifer L
Purchase Details
Closed on
Aug 11, 2008
Sold by
Lorenzen Edith
Bought by
Mcguire Marc L and Mcguire Jennifer L
Purchase Details
Closed on
Jan 10, 2007
Sold by
Cavanagh Janis Lynn
Bought by
Mcguire Marc L and Mcguire Jennifer L
Purchase Details
Closed on
Nov 15, 2006
Sold by
Cavanagh Janis Lynn
Bought by
Mcguire Marc L and Mcguire Jennifer L
Create a Home Valuation Report for This Property
The Home Valuation Report is an in-depth analysis detailing your home's value as well as a comparison with similar homes in the area
Home Values in the Area
Average Home Value in this Area
Purchase History
| Date | Buyer | Sale Price | Title Company |
|---|---|---|---|
| Frank J A | -- | Us Title | |
| The Janis Lyn Cavanagh Living Trust | -- | None Available | |
| Cavanagh Janis | -- | Northern Title Company | |
| Mcguire Marc L | -- | Accommodation | |
| Mcguire Marc L | -- | Northern Title Company | |
| Mcguire Marc L | -- | Northern Title Company |
Source: Public Records
Tax History
| Year | Tax Paid | Tax Assessment Tax Assessment Total Assessment is a certain percentage of the fair market value that is determined by local assessors to be the total taxable value of land and additions on the property. | Land | Improvement |
|---|---|---|---|---|
| 2025 | $1,205 | $173,055 | $0 | $0 |
| 2023 | $1,330 | $170,500 | $0 | $0 |
| 2022 | $1,336 | $164,185 | $0 | $0 |
| 2021 | $1,226 | $232,015 | $65,740 | $166,275 |
| 2020 | $1,090 | $193,644 | $65,740 | $127,904 |
| 2019 | $1,012 | $169,024 | $41,120 | $127,904 |
| 2018 | $962 | $155,320 | $41,120 | $114,200 |
| 2017 | $844 | $70,740 | $0 | $0 |
| 2016 | $863 | $70,740 | $0 | $0 |
| 2015 | $865 | $70,740 | $0 | $0 |
| 2014 | $844 | $70,575 | $0 | $0 |
| 2013 | -- | $70,575 | $0 | $0 |
Source: Public Records
Map
Nearby Homes
Your Personal Tour Guide
Ask me questions while you tour the home.