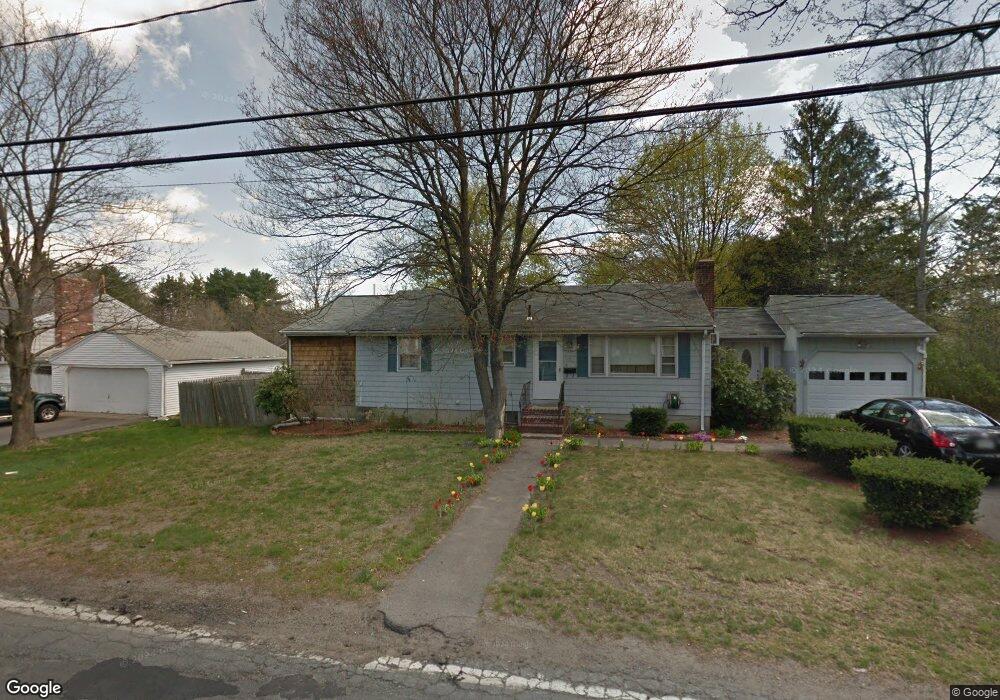
396 East St Brockton, MA 02302
Estimated Value: $491,000 - $509,018
3
Beds
1
Bath
1,280
Sq Ft
$390/Sq Ft
Est. Value
About This Home
This home is located at 396 East St, Brockton, MA 02302 and is currently estimated at $499,005, approximately $389 per square foot. 396 East St is a home located in Plymouth County with nearby schools including Davis K-8 School, John F. Kennedy Elementary School, and South Middle School.
Ownership History
Date
Name
Owned For
Owner Type
Purchase Details
Closed on
Aug 15, 1988
Sold by
Gomez Helen C
Bought by
Singleton Jessie L
Current Estimated Value
Home Financials for this Owner
Home Financials are based on the most recent Mortgage that was taken out on this home.
Original Mortgage
$108,000
Interest Rate
10.34%
Mortgage Type
Purchase Money Mortgage
Purchase Details
Closed on
Sep 22, 1987
Sold by
Comfed Savings Bank
Bought by
Gomez Helen C
Create a Home Valuation Report for This Property
The Home Valuation Report is an in-depth analysis detailing your home's value as well as a comparison with similar homes in the area
Home Values in the Area
Average Home Value in this Area
Purchase History
| Date | Buyer | Sale Price | Title Company |
|---|---|---|---|
| Singleton Jessie L | $120,000 | -- | |
| Gomez Helen C | $107,000 | -- |
Source: Public Records
Mortgage History
| Date | Status | Borrower | Loan Amount |
|---|---|---|---|
| Open | Gomez Helen C | $160,000 | |
| Closed | Gomez Helen C | $156,000 | |
| Closed | Gomez Helen C | $22,000 | |
| Closed | Gomez Helen C | $108,000 |
Source: Public Records
Tax History Compared to Growth
Tax History
| Year | Tax Paid | Tax Assessment Tax Assessment Total Assessment is a certain percentage of the fair market value that is determined by local assessors to be the total taxable value of land and additions on the property. | Land | Improvement |
|---|---|---|---|---|
| 2025 | $5,061 | $417,900 | $168,900 | $249,000 |
| 2024 | $5,012 | $417,000 | $168,900 | $248,100 |
| 2023 | $4,818 | $371,200 | $120,100 | $251,100 |
| 2022 | $4,610 | $330,000 | $109,200 | $220,800 |
| 2021 | $4,195 | $289,300 | $101,000 | $188,300 |
| 2020 | $4,394 | $290,000 | $88,000 | $202,000 |
| 2019 | $4,258 | $274,000 | $84,500 | $189,500 |
| 2018 | $3,724 | $231,900 | $84,500 | $147,400 |
| 2017 | $3,532 | $219,400 | $84,500 | $134,900 |
| 2016 | $3,508 | $202,100 | $80,600 | $121,500 |
| 2015 | $3,233 | $178,100 | $80,600 | $97,500 |
| 2014 | $3,062 | $168,900 | $80,600 | $88,300 |
Source: Public Records
Map
Nearby Homes