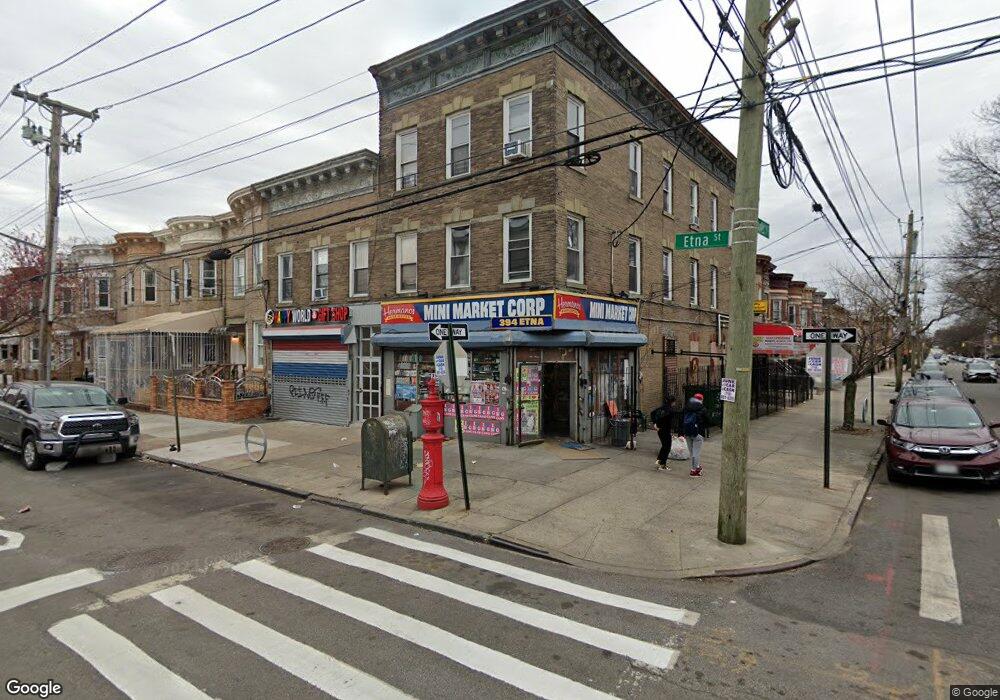
396 Etna St Brooklyn, NY 11208
Cypress Hills NeighborhoodEstimated Value: $448,624
--
Bed
--
Bath
2,500
Sq Ft
$179/Sq Ft
Est. Value
About This Home
This home is located at 396 Etna St, Brooklyn, NY 11208 and is currently priced at $448,624, approximately $179 per square foot. 396 Etna St is a home located in Kings County with nearby schools including P.S. 7 - Abraham Lincoln, Westridge Elementary School, and Is 171 Abraham Lincoln.
Ownership History
Date
Name
Owned For
Owner Type
Purchase Details
Closed on
Jan 23, 2019
Sold by
Rock Hen Corp
Bought by
Chris Chris Kelly Llc
Current Estimated Value
Purchase Details
Closed on
Oct 15, 2001
Sold by
Duncanson Frank and Duncanson Carol
Bought by
King Yee Dianna and King Yee
Purchase Details
Closed on
May 15, 1996
Sold by
Giambone Agnes and Merlino Marie
Bought by
Duncanson Frank and Duncanson Carol
Home Financials for this Owner
Home Financials are based on the most recent Mortgage that was taken out on this home.
Original Mortgage
$112,000
Interest Rate
7.98%
Mortgage Type
FHA
Create a Home Valuation Report for This Property
The Home Valuation Report is an in-depth analysis detailing your home's value as well as a comparison with similar homes in the area
Home Values in the Area
Average Home Value in this Area
Purchase History
| Date | Buyer | Sale Price | Title Company |
|---|---|---|---|
| Chris Chris Kelly Llc | $400,000 | -- | |
| King Yee Dianna | -- | -- | |
| Duncanson Frank | $100,000 | -- |
Source: Public Records
Mortgage History
| Date | Status | Borrower | Loan Amount |
|---|---|---|---|
| Previous Owner | Duncanson Frank | $112,000 |
Source: Public Records
Tax History Compared to Growth
Tax History
| Year | Tax Paid | Tax Assessment Tax Assessment Total Assessment is a certain percentage of the fair market value that is determined by local assessors to be the total taxable value of land and additions on the property. | Land | Improvement |
|---|---|---|---|---|
| 2025 | $5,015 | $57,960 | $10,860 | $47,100 |
| 2024 | $5,015 | $53,580 | $10,860 | $42,720 |
| 2023 | $5,071 | $54,840 | $10,860 | $43,980 |
| 2022 | $4,796 | $45,180 | $10,860 | $34,320 |
| 2021 | $4,770 | $40,800 | $10,860 | $29,940 |
| 2020 | $3,578 | $37,980 | $10,860 | $27,120 |
| 2019 | $4,353 | $33,000 | $10,860 | $22,140 |
| 2018 | $4,242 | $20,808 | $8,223 | $12,585 |
| 2017 | $4,081 | $20,022 | $8,487 | $11,535 |
| 2016 | $3,776 | $18,889 | $9,604 | $9,285 |
| 2015 | $2,572 | $17,820 | $10,860 | $6,960 |
| 2014 | $2,572 | $17,340 | $10,860 | $6,480 |
Source: Public Records
Map
Nearby Homes