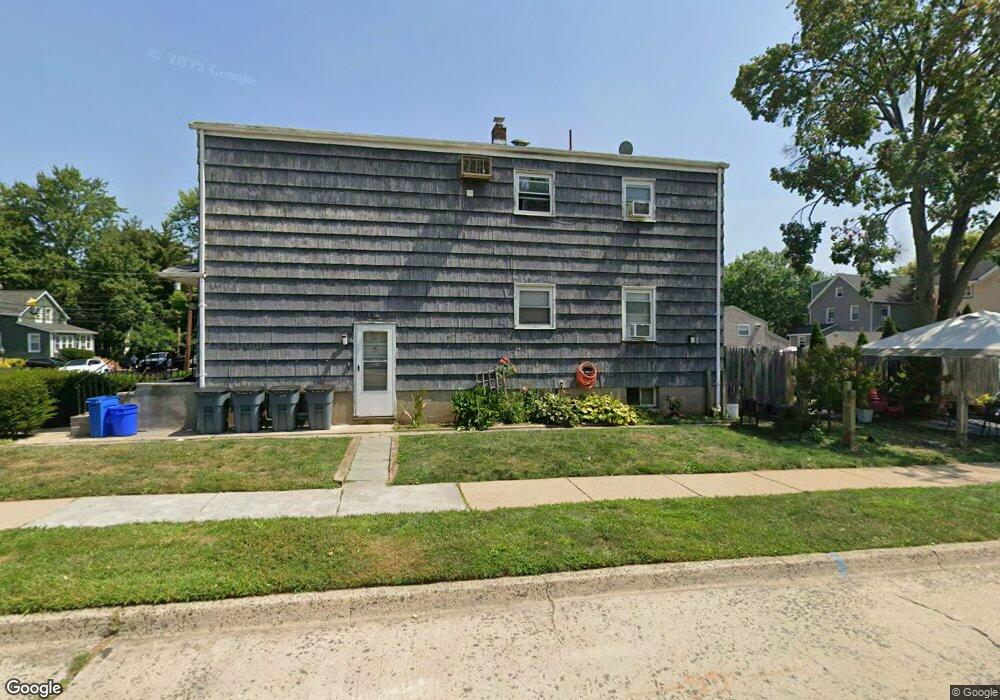
396 Kipp St Teaneck, NJ 07666
Estimated Value: $718,514 - $831,000
Studio
--
Bath
2,460
Sq Ft
$318/Sq Ft
Est. Value
About This Home
This home is located at 396 Kipp St, Teaneck, NJ 07666 and is currently estimated at $782,129, approximately $317 per square foot. 396 Kipp St is a home located in Bergen County with nearby schools including Teaneck Senior High School, Teaneck Community Charter School, and Bogota Middle School.
Ownership History
Date
Name
Owned For
Owner Type
Purchase Details
Closed on
Oct 20, 2004
Sold by
Diaz Mercedes
Bought by
Celaj Nderim
Current Estimated Value
Home Financials for this Owner
Home Financials are based on the most recent Mortgage that was taken out on this home.
Original Mortgage
$416,000
Outstanding Balance
$205,195
Interest Rate
5.71%
Estimated Equity
$576,934
Purchase Details
Closed on
Oct 26, 1993
Sold by
Pearson Raymond
Bought by
Horjales Octavia and Diaz Mercedes
Home Financials for this Owner
Home Financials are based on the most recent Mortgage that was taken out on this home.
Original Mortgage
$180,000
Interest Rate
6.86%
Create a Home Valuation Report for This Property
The Home Valuation Report is an in-depth analysis detailing your home's value as well as a comparison with similar homes in the area
Home Values in the Area
Average Home Value in this Area
Purchase History
| Date | Buyer | Sale Price | Title Company |
|---|---|---|---|
| Celaj Nderim | $520,000 | -- | |
| Horjales Octavia | $226,000 | -- |
Source: Public Records
Mortgage History
| Date | Status | Borrower | Loan Amount |
|---|---|---|---|
| Open | Celaj Nderim | $416,000 | |
| Previous Owner | Horjales Octavia | $180,000 |
Source: Public Records
Tax History
| Year | Tax Paid | Tax Assessment Tax Assessment Total Assessment is a certain percentage of the fair market value that is determined by local assessors to be the total taxable value of land and additions on the property. | Land | Improvement |
|---|---|---|---|---|
| 2025 | $12,783 | $585,300 | $257,900 | $327,400 |
| 2024 | $12,528 | $585,300 | $257,900 | $327,400 |
| 2023 | $12,281 | $379,400 | $158,900 | $220,500 |
| 2022 | $12,281 | $379,400 | $158,900 | $220,500 |
| 2021 | $12,353 | $379,400 | $158,900 | $220,500 |
| 2020 | $12,270 | $379,400 | $158,900 | $220,500 |
| 2019 | $12,129 | $379,400 | $158,900 | $220,500 |
| 2018 | $12,038 | $379,400 | $158,900 | $220,500 |
| 2017 | $11,925 | $379,400 | $158,900 | $220,500 |
| 2016 | $11,746 | $379,400 | $158,900 | $220,500 |
| 2015 | $11,560 | $379,400 | $158,900 | $220,500 |
| 2014 | $13,696 | $532,700 | $218,500 | $314,200 |
Source: Public Records
Map
Nearby Homes
Your Personal Tour Guide
Ask me questions while you tour the home.