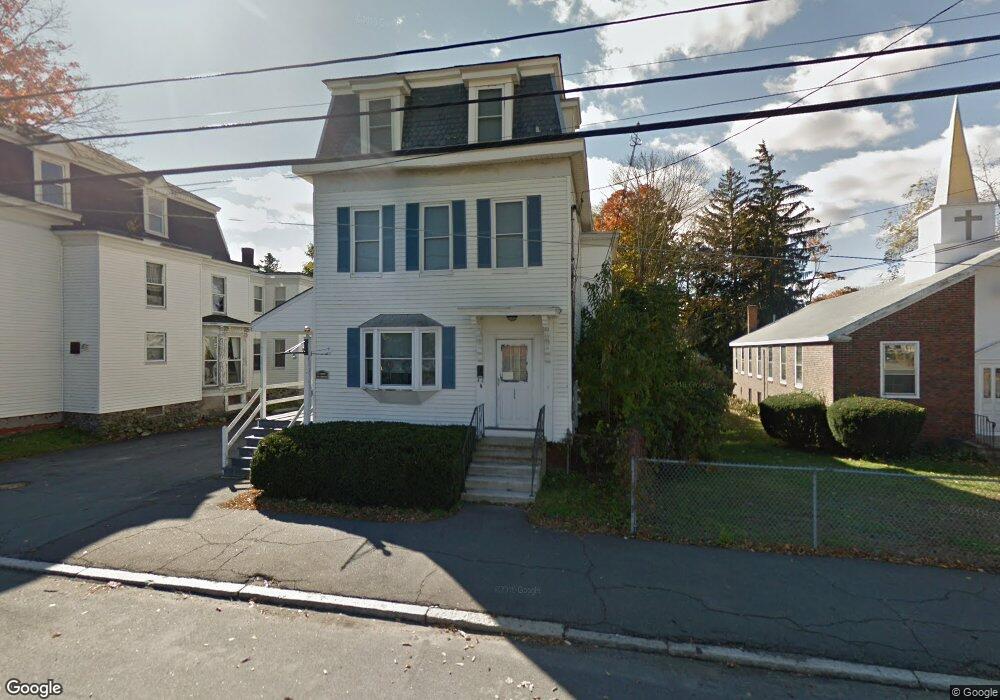
396 Main St Unit 2 Haverhill, MA 01830
Lower Acres NeighborhoodEstimated Value: $631,348
1
Bed
1
Bath
930
Sq Ft
$679/Sq Ft
Est. Value
About This Home
This home is located at 396 Main St Unit 2, Haverhill, MA 01830 and is currently estimated at $631,348, approximately $678 per square foot. 396 Main St Unit 2 is a home located in Essex County with nearby schools including Pentucket Lake Elementary School.
Ownership History
Date
Name
Owned For
Owner Type
Purchase Details
Closed on
Nov 14, 2012
Sold by
Blum Krista M
Bought by
Krista M Blum Ret and Blum
Current Estimated Value
Home Financials for this Owner
Home Financials are based on the most recent Mortgage that was taken out on this home.
Original Mortgage
$150,000
Outstanding Balance
$103,800
Interest Rate
3.42%
Mortgage Type
Commercial
Estimated Equity
$527,548
Create a Home Valuation Report for This Property
The Home Valuation Report is an in-depth analysis detailing your home's value as well as a comparison with similar homes in the area
Home Values in the Area
Average Home Value in this Area
Purchase History
| Date | Buyer | Sale Price | Title Company |
|---|---|---|---|
| Krista M Blum Ret | -- | -- |
Source: Public Records
Mortgage History
| Date | Status | Borrower | Loan Amount |
|---|---|---|---|
| Open | Krista M Blum Ret | $150,000 |
Source: Public Records
Tax History Compared to Growth
Tax History
| Year | Tax Paid | Tax Assessment Tax Assessment Total Assessment is a certain percentage of the fair market value that is determined by local assessors to be the total taxable value of land and additions on the property. | Land | Improvement |
|---|---|---|---|---|
| 2025 | -- | $541,300 | $159,200 | $382,100 |
| 2024 | -- | $481,600 | $151,600 | $330,000 |
| 2023 | $0 | $437,800 | $151,600 | $286,200 |
| 2022 | $0 | $383,400 | $139,500 | $243,900 |
| 2021 | $0 | $350,200 | $124,300 | $225,900 |
| 2020 | $0 | $344,100 | $118,200 | $225,900 |
| 2019 | $0 | $304,300 | $103,100 | $201,200 |
| 2018 | $0 | $294,300 | $97,000 | $197,300 |
| 2017 | $0 | $266,000 | $83,400 | $182,600 |
| 2016 | -- | $234,500 | $63,700 | $170,800 |
| 2015 | -- | $226,700 | $63,700 | $163,000 |
Source: Public Records
Map
Nearby Homes
- 16 Fountain St
- 16 Dudley St
- 25-27 Dover St
- 34 7th Ave
- 6 Dexter St
- 20 Ashland St
- 81-83 Kenoza Ave
- 151 Franklin St
- 192 Franklin St
- 23 Arlington St
- 13-15 Arlington St
- 17 Arlington St
- 48 Portland St
- 5 Kimball St
- 7 Clinton St Unit 4
- 33 Hamilton Ave
- 11 York St Unit 11
- 9 York St Unit 9
- 100 Lawrence St Unit 5
- 25 Portland St