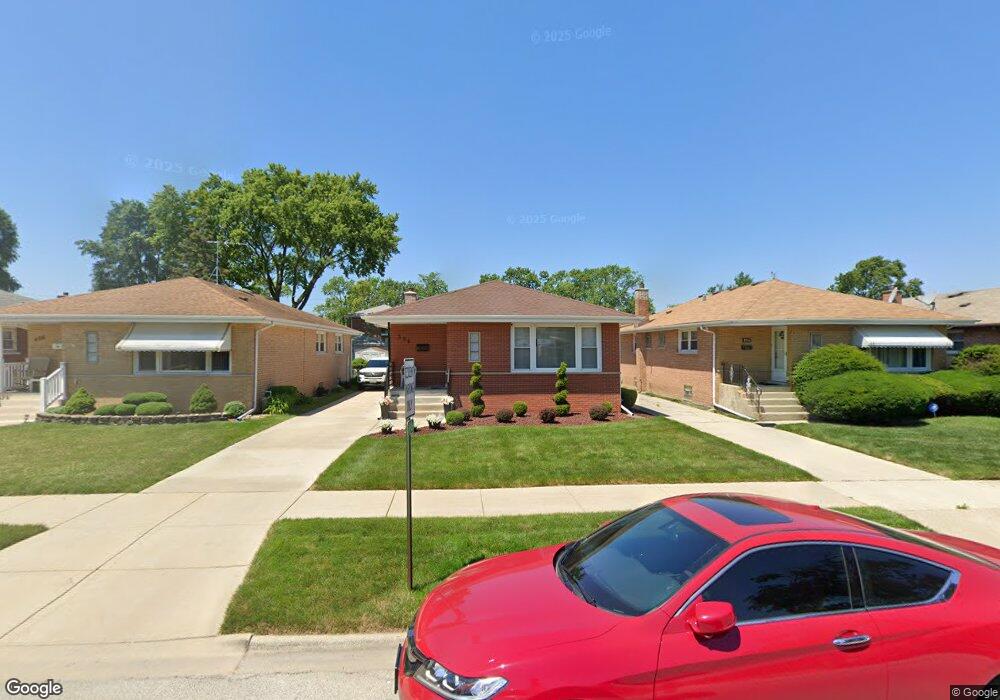
396 Oglesby Ave Calumet City, IL 60409
Estimated Value: $191,601 - $255,000
3
Beds
3
Baths
1,220
Sq Ft
$187/Sq Ft
Est. Value
About This Home
This home is located at 396 Oglesby Ave, Calumet City, IL 60409 and is currently estimated at $228,150, approximately $187 per square foot. 396 Oglesby Ave is a home located in Cook County with nearby schools including Caroline Sibley Elementary School, School Of Fine Arts Academy, and Creative Communications Academy.
Ownership History
Date
Name
Owned For
Owner Type
Purchase Details
Closed on
Oct 23, 2012
Sold by
Threlkeld William L
Bought by
Threlkeld Jevon V and Threlkeld William L
Current Estimated Value
Purchase Details
Closed on
Nov 15, 2010
Sold by
Standard Bank & Trust Company
Bought by
Threlkeld William L
Home Financials for this Owner
Home Financials are based on the most recent Mortgage that was taken out on this home.
Original Mortgage
$148,100
Interest Rate
4.17%
Mortgage Type
VA
Purchase Details
Closed on
Apr 5, 2010
Sold by
Hsbc Bank Usa
Bought by
Standard Bank & Trust
Purchase Details
Closed on
Mar 1, 2010
Sold by
Merkson Renita and Ogunyimika Renita
Bought by
Hsbc Bank Usa
Purchase Details
Closed on
Oct 10, 2003
Sold by
Miller Stephen and Miller Barbara R
Bought by
Merkson Renita
Home Financials for this Owner
Home Financials are based on the most recent Mortgage that was taken out on this home.
Original Mortgage
$117,600
Interest Rate
7.62%
Mortgage Type
Unknown
Create a Home Valuation Report for This Property
The Home Valuation Report is an in-depth analysis detailing your home's value as well as a comparison with similar homes in the area
Home Values in the Area
Average Home Value in this Area
Purchase History
| Date | Buyer | Sale Price | Title Company |
|---|---|---|---|
| Threlkeld Jevon V | -- | -- | |
| Threlkeld Jevon V | -- | -- | |
| Threlkeld William L | $150,000 | Git | |
| Standard Bank & Trust | $52,000 | Servicelink | |
| Hsbc Bank Usa | -- | None Available | |
| Merkson Renita | $147,000 | Pntn |
Source: Public Records
Mortgage History
| Date | Status | Borrower | Loan Amount |
|---|---|---|---|
| Previous Owner | Threlkeld William L | $148,100 | |
| Previous Owner | Merkson Renita | $117,600 | |
| Closed | Merkson Renita | $29,400 |
Source: Public Records
Tax History Compared to Growth
Tax History
| Year | Tax Paid | Tax Assessment Tax Assessment Total Assessment is a certain percentage of the fair market value that is determined by local assessors to be the total taxable value of land and additions on the property. | Land | Improvement |
|---|---|---|---|---|
| 2024 | $6,615 | $13,908 | $2,772 | $11,136 |
| 2023 | $4,451 | $13,908 | $2,772 | $11,136 |
| 2022 | $4,451 | $9,044 | $2,394 | $6,650 |
| 2021 | $4,259 | $9,043 | $2,394 | $6,649 |
| 2020 | $7,565 | $11,129 | $2,394 | $8,735 |
| 2019 | $2,302 | $9,291 | $2,016 | $7,275 |
| 2018 | $1,654 | $9,291 | $2,016 | $7,275 |
| 2017 | $1,558 | $9,291 | $2,016 | $7,275 |
| 2016 | $2,987 | $9,200 | $1,890 | $7,310 |
| 2015 | $3,064 | $9,200 | $1,890 | $7,310 |
| 2014 | $2,943 | $9,200 | $1,890 | $7,310 |
| 2013 | $2,822 | $9,259 | $1,890 | $7,369 |
Source: Public Records
Map
Nearby Homes
- 394 Oglesby Ave
- 400 Oglesby Ave
- 390 Oglesby Ave
- 402 Oglesby Ave
- 386 Oglesby Ave
- 406 Oglesby Ave
- 393 Crandon Ave
- 399 Crandon Ave
- 408 Oglesby Ave
- 401 Crandon Ave
- 395 Oglesby Ave Unit 2
- 395 Oglesby Ave
- 395 Oglesby Ave Unit 1
- 405 Crandon Ave
- 391 Oglesby Ave
- 387 Crandon Ave
- 393 Oglesby Ave
- 399 Oglesby Ave
- 399 Oglesby Ave Unit 2