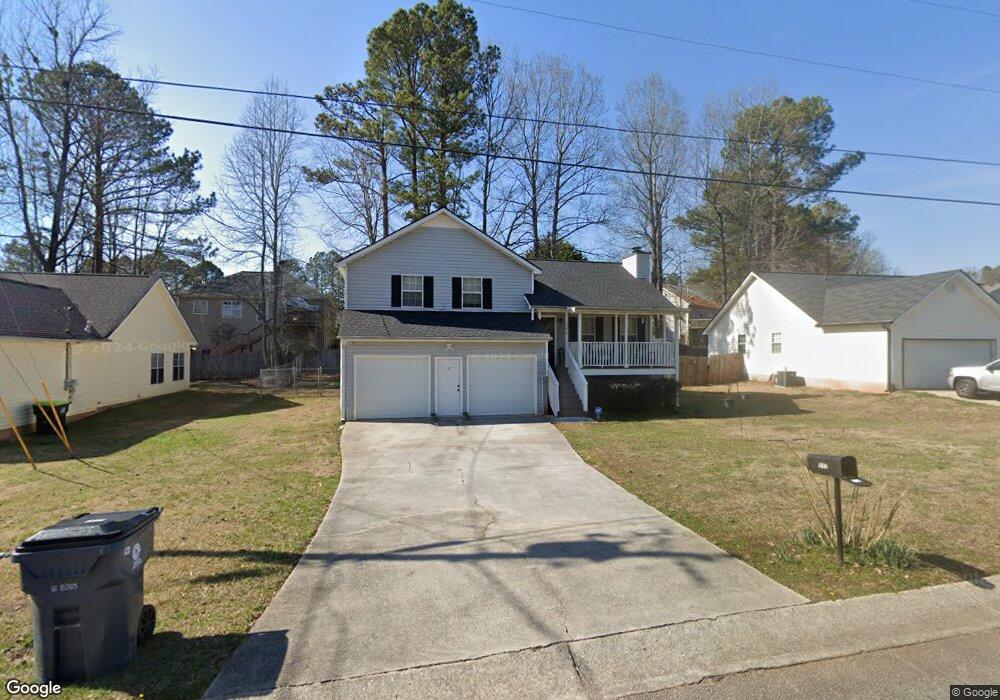
396 Villa Rosa Way Unit 125 Temple, GA 30179
Estimated Value: $222,000 - $230,955
3
Beds
2
Baths
1,082
Sq Ft
$210/Sq Ft
Est. Value
About This Home
This home is located at 396 Villa Rosa Way Unit 125, Temple, GA 30179 and is currently estimated at $227,489, approximately $210 per square foot. 396 Villa Rosa Way Unit 125 is a home located in Carroll County with nearby schools including Temple Elementary School, Temple Middle School, and Temple High School.
Ownership History
Date
Name
Owned For
Owner Type
Purchase Details
Closed on
Sep 9, 2016
Sold by
Atlanta R E Ventures Llc
Bought by
Reynolds Gerry R and Reynolds Brenda G
Current Estimated Value
Home Financials for this Owner
Home Financials are based on the most recent Mortgage that was taken out on this home.
Original Mortgage
$95,243
Outstanding Balance
$76,849
Interest Rate
3.75%
Mortgage Type
FHA
Estimated Equity
$150,640
Purchase Details
Closed on
Apr 20, 2009
Sold by
Voyles Todd
Bought by
Atlanta Real Ventures L
Purchase Details
Closed on
Sep 10, 2002
Sold by
Secretary Of Hud
Bought by
Voyles Todd
Purchase Details
Closed on
Feb 5, 2002
Sold by
Aurora Loan Services Inc
Bought by
Secretary Of Hud
Purchase Details
Closed on
Apr 28, 2000
Sold by
Rjo Designer Homes I
Bought by
Mitchell Michael B
Purchase Details
Closed on
Apr 1, 1999
Sold by
Dobbins Terry Inc
Bought by
Rjo Designer Homes I
Create a Home Valuation Report for This Property
The Home Valuation Report is an in-depth analysis detailing your home's value as well as a comparison with similar homes in the area
Home Values in the Area
Average Home Value in this Area
Purchase History
| Date | Buyer | Sale Price | Title Company |
|---|---|---|---|
| Reynolds Gerry R | $97,000 | -- | |
| Atlanta Real Ventures L | -- | -- | |
| Voyles Todd | -- | -- | |
| Secretary Of Hud | $97,500 | -- | |
| Aurora Loan Services Inc | $97,500 | -- | |
| Mitchell Michael B | $85,000 | -- | |
| Rjo Designer Homes I | $13,000 | -- |
Source: Public Records
Mortgage History
| Date | Status | Borrower | Loan Amount |
|---|---|---|---|
| Open | Reynolds Gerry R | $95,243 |
Source: Public Records
Tax History Compared to Growth
Tax History
| Year | Tax Paid | Tax Assessment Tax Assessment Total Assessment is a certain percentage of the fair market value that is determined by local assessors to be the total taxable value of land and additions on the property. | Land | Improvement |
|---|---|---|---|---|
| 2024 | $599 | $77,981 | $6,000 | $71,981 |
| 2023 | $599 | $71,518 | $6,000 | $65,518 |
| 2022 | $630 | $58,592 | $6,000 | $52,592 |
| 2021 | $608 | $51,149 | $6,000 | $45,149 |
| 2020 | $1,364 | $43,686 | $6,000 | $37,686 |
| 2019 | $1,130 | $40,675 | $6,000 | $34,675 |
| 2018 | $1,019 | $34,717 | $4,800 | $29,917 |
| 2017 | $1,032 | $34,717 | $4,800 | $29,917 |
| 2016 | $1,140 | $34,717 | $4,800 | $29,917 |
| 2015 | $980 | $28,059 | $6,000 | $22,060 |
| 2014 | $986 | $28,060 | $6,000 | $22,060 |
Source: Public Records
Map
Nearby Homes
- 108 Villa Rosa Ridge
- 68 Villa Rosa Dr
- 408 Reagan Dr
- 98 W Lakeview Dr
- 0 Bar J Rd Unit 10578558
- 0 Bar J Rd Unit 7627694
- 128 W Lakeview Dr
- 341 Oak Shade Rd
- 528 Clinton Dr
- 384 Double d Rd
- 566 Clinton Dr
- 396 Lakeridge Dr
- 355 Double d Rd
- 224 Villa Rica Springs
- 216 Hunt Club Cir
- 105 Fawn Ln
- 848 Windy Mill Ct
- 28 Hickory Trail
- 832 Windy Mill Ct
- 0 Pleasant Oak Dr Unit 10610473
- 396 Villa Rosa Way
- 404 Villa Rosa Way
- 404 Villa Rosa Way Unit 126
- 388 Villa Rosa Way
- 127 Villa Rosa Ridge
- 119 Villa Rosa Ridge Unit 193
- 119 Villa Rosa Ridge
- 403 Villa Rosa Way
- 403 Villa Rosa Way
- 111 Villa Rosa Ridge
- 412 Villa Rosa Way
- 135 Villa Rosa Ridge
- 103 Villa Rosa Ridge
- 411 Villa Rosa Way
- 111 Villa Rosa Ln
- 387 Villa Rosa Way
- 143 Villa Rosa Ridge
- 211 Villa Cove
- 419 Villa Rosa Way
- 126 Villa Rosa Ridge