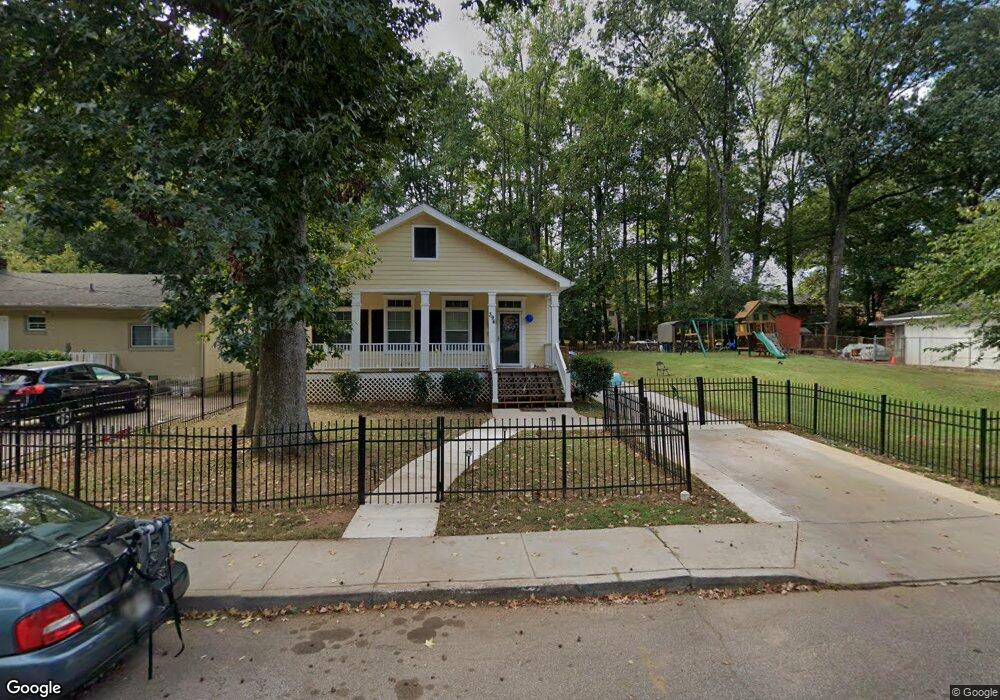
396 Walnut St Atlanta, GA 30354
Estimated Value: $355,865 - $419,000
3
Beds
2
Baths
1,740
Sq Ft
$220/Sq Ft
Est. Value
About This Home
This home is located at 396 Walnut St, Atlanta, GA 30354 and is currently estimated at $381,966, approximately $219 per square foot. 396 Walnut St is a home located in Fulton County with nearby schools including Hapeville Elementary School, Paul D. West Middle School, and Tri-Cities High School.
Ownership History
Date
Name
Owned For
Owner Type
Purchase Details
Closed on
Apr 23, 2010
Sold by
Palm Harbor Homes Inc
Bought by
Turner Sheakita
Current Estimated Value
Home Financials for this Owner
Home Financials are based on the most recent Mortgage that was taken out on this home.
Original Mortgage
$147,283
Outstanding Balance
$99,876
Interest Rate
5.37%
Mortgage Type
FHA
Estimated Equity
$282,090
Purchase Details
Closed on
Oct 13, 2005
Sold by
Baldwin Tays Co
Bought by
Palm Harbor Homes Inc
Purchase Details
Closed on
Mar 24, 2005
Sold by
Dallas Equities Llc
Bought by
Lincoln Allen Llc
Purchase Details
Closed on
Oct 1, 2002
Sold by
Sheriff/Fulton County
Bought by
Dallas Equities Llc
Purchase Details
Closed on
May 31, 2002
Sold by
Levy Lenora
Bought by
Levy Sean K and Levy Melissa A
Purchase Details
Closed on
May 30, 2002
Sold by
Levy George S
Bought by
Levy Sean K and Levy Melissa A
Create a Home Valuation Report for This Property
The Home Valuation Report is an in-depth analysis detailing your home's value as well as a comparison with similar homes in the area
Home Values in the Area
Average Home Value in this Area
Purchase History
| Date | Buyer | Sale Price | Title Company |
|---|---|---|---|
| Turner Sheakita | $150,000 | -- | |
| Palm Harbor Homes Inc | $62,000 | -- | |
| Lincoln Allen Llc | $30,800 | -- | |
| Dallas Equities Llc | $2,337 | -- | |
| Levy Sean K | -- | -- | |
| Levy Sean K | -- | -- |
Source: Public Records
Mortgage History
| Date | Status | Borrower | Loan Amount |
|---|---|---|---|
| Open | Turner Sheakita | $147,283 |
Source: Public Records
Tax History Compared to Growth
Tax History
| Year | Tax Paid | Tax Assessment Tax Assessment Total Assessment is a certain percentage of the fair market value that is determined by local assessors to be the total taxable value of land and additions on the property. | Land | Improvement |
|---|---|---|---|---|
| 2025 | $2,271 | $145,440 | $30,640 | $114,800 |
| 2023 | $2,271 | $144,720 | $37,480 | $107,240 |
| 2022 | $896 | $123,440 | $47,840 | $75,600 |
| 2021 | $2,099 | $92,320 | $31,520 | $60,800 |
| 2020 | $1,952 | $81,400 | $26,720 | $54,680 |
| 2019 | $1,156 | $81,760 | $10,600 | $71,160 |
| 2018 | $1,727 | $79,840 | $10,320 | $69,520 |
| 2017 | $534 | $30,240 | $5,600 | $24,640 |
| 2016 | $532 | $30,240 | $5,600 | $24,640 |
| 2015 | $870 | $30,240 | $5,600 | $24,640 |
| 2014 | $536 | $30,240 | $5,600 | $24,640 |
Source: Public Records
Map
Nearby Homes