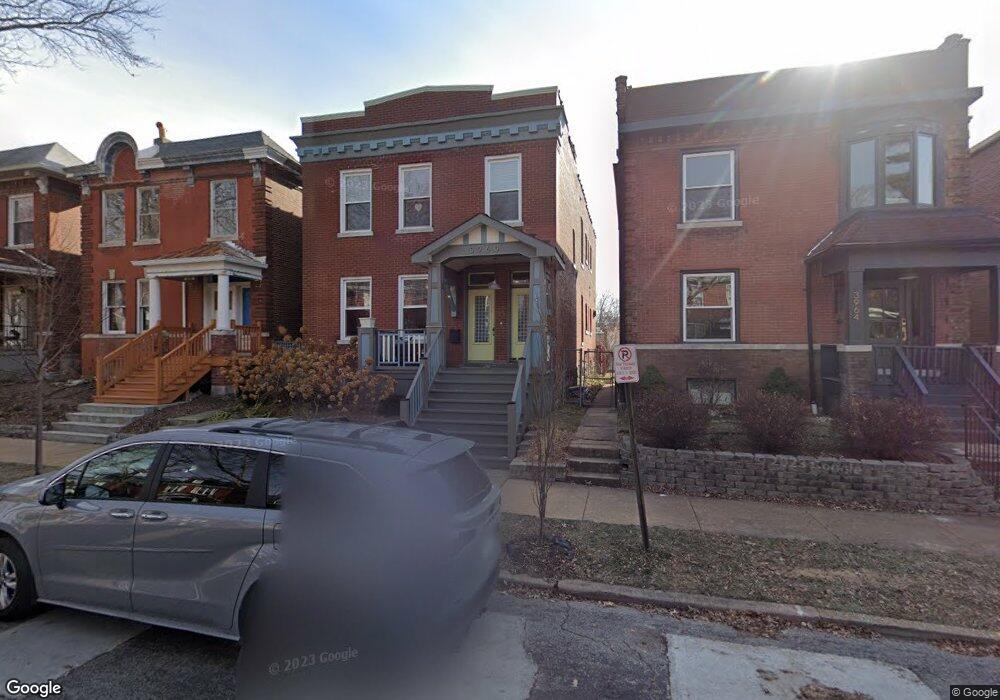
3960 Wyoming St Unit A Saint Louis, MO 63116
Tower Grove South NeighborhoodEstimated Value: $484,000 - $547,000
3
Beds
1
Bath
2,558
Sq Ft
$201/Sq Ft
Est. Value
About This Home
This home is located at 3960 Wyoming St Unit A, Saint Louis, MO 63116 and is currently estimated at $513,081, approximately $200 per square foot. 3960 Wyoming St Unit A is a home located in St. Louis City with nearby schools including Mann Elementary School, Roosevelt High School, and Momentum Academy Tower Grove East.
Ownership History
Date
Name
Owned For
Owner Type
Purchase Details
Closed on
Mar 1, 2016
Sold by
Thfia Llc
Bought by
Craft Tim and Fitzsimmons Craft Ellen
Current Estimated Value
Home Financials for this Owner
Home Financials are based on the most recent Mortgage that was taken out on this home.
Original Mortgage
$317,900
Outstanding Balance
$252,946
Interest Rate
3.81%
Mortgage Type
New Conventional
Estimated Equity
$260,135
Purchase Details
Closed on
Jan 27, 2014
Sold by
Mandziara Brian M and Mandziara Sarah L
Bought by
Federal National Mortgage Association
Purchase Details
Closed on
Dec 17, 2008
Sold by
Deutsche Bank National Trust Company
Bought by
Mandziara Brian M and Mandziara Sarah L
Home Financials for this Owner
Home Financials are based on the most recent Mortgage that was taken out on this home.
Original Mortgage
$97,500
Interest Rate
5%
Mortgage Type
Future Advance Clause Open End Mortgage
Create a Home Valuation Report for This Property
The Home Valuation Report is an in-depth analysis detailing your home's value as well as a comparison with similar homes in the area
Home Values in the Area
Average Home Value in this Area
Purchase History
| Date | Buyer | Sale Price | Title Company |
|---|---|---|---|
| Craft Tim | -- | None Available | |
| Federal National Mortgage Association | $86,746 | None Available | |
| Mandziara Brian M | -- | None Available |
Source: Public Records
Mortgage History
| Date | Status | Borrower | Loan Amount |
|---|---|---|---|
| Open | Craft Tim | $317,900 | |
| Previous Owner | Mandziara Brian M | $97,500 |
Source: Public Records
Tax History Compared to Growth
Tax History
| Year | Tax Paid | Tax Assessment Tax Assessment Total Assessment is a certain percentage of the fair market value that is determined by local assessors to be the total taxable value of land and additions on the property. | Land | Improvement |
|---|---|---|---|---|
| 2025 | $6,905 | $96,540 | $2,280 | $94,260 |
| 2024 | $6,567 | $82,160 | $2,280 | $79,880 |
| 2023 | $6,567 | $82,160 | $2,280 | $79,880 |
| 2022 | $6,166 | $74,250 | $2,280 | $71,970 |
| 2021 | $5,863 | $70,690 | $2,280 | $68,410 |
| 2020 | $5,087 | $61,770 | $2,280 | $59,490 |
| 2019 | $5,070 | $61,770 | $2,280 | $59,490 |
| 2018 | $4,278 | $50,490 | $2,000 | $48,490 |
| 2017 | $4,206 | $50,480 | $2,000 | $48,490 |
| 2016 | $1,226 | $14,290 | $2,000 | $12,290 |
| 2015 | $1,113 | $14,290 | $2,000 | $12,290 |
| 2014 | $1,030 | $14,290 | $2,000 | $12,290 |
| 2013 | -- | $13,210 | $2,000 | $11,210 |
Source: Public Records
Map
Nearby Homes
- 3931 Wyoming St
- 3937 Humphrey St
- 4062 Wyoming St
- 3964 Arsenal St
- 4127 Juniata St
- 4020 Parker Ave
- 3119 Oak Hill Ave
- 4147 Connecticut St
- 3958 Fairview Ave
- 4152 Hartford St
- 3823 Potomac St
- 4151 Hartford St
- 3407 Giles Ave
- 4207 Connecticut St
- 4216 Wyoming St
- 4169 Parker Ave
- 4064 Potomac St
- 3704 Fairview Ave
- 3467 Giles Ave
- 4250 Wyoming St
- 3960 Wyoming St
- 3956 Wyoming St
- 3966 Wyoming St
- 3954 Wyoming St
- 3970 Wyoming St
- 3950 Wyoming St
- 3972 Wyoming St
- 3948 Wyoming St
- 3959 Humphrey St
- 4000 Wyoming St
- 3974 Wyoming St
- 3963 Humphrey St
- 3957 Humphrey St
- 3967 Humphrey St
- 3944 Wyoming St
- 3955 Humphrey St
- 3969 Humphrey St
- 3951 Humphrey St
- 3942 Wyoming St
- 3959 Wyoming St