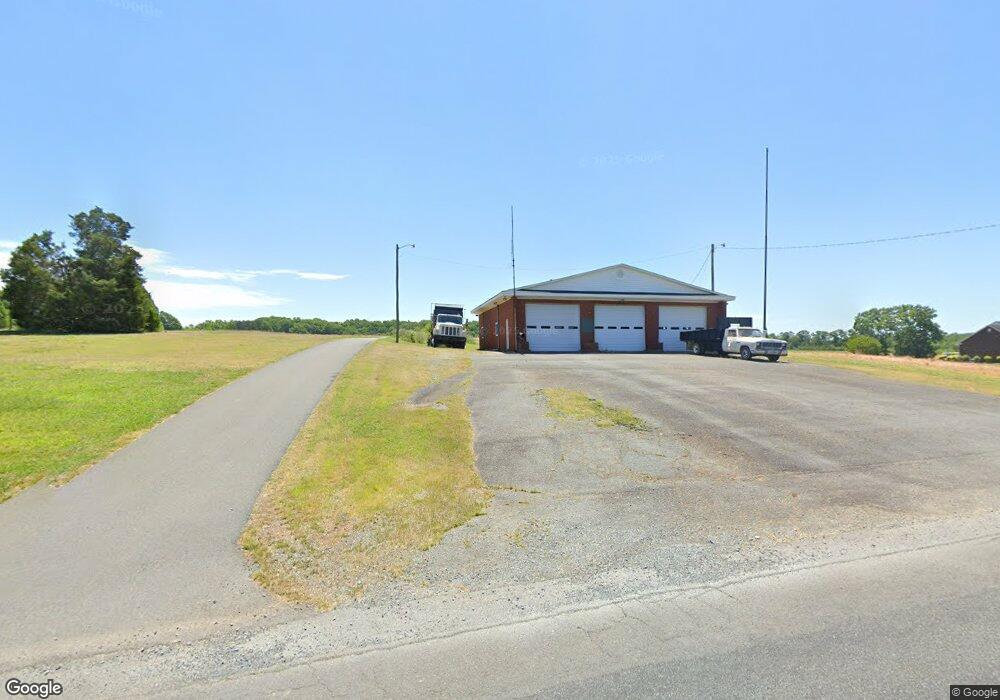
39600 Moose Farm Rd Albemarle, NC 28001
Estimated Value: $70,164
--
Bed
2
Baths
2,400
Sq Ft
$29/Sq Ft
Est. Value
About This Home
This home is located at 39600 Moose Farm Rd, Albemarle, NC 28001 and is currently estimated at $70,164, approximately $29 per square foot. 39600 Moose Farm Rd is a home located in Stanly County with nearby schools including Norwood Elementary School, South Stanly Middle School, and South Stanly High School.
Ownership History
Date
Name
Owned For
Owner Type
Purchase Details
Closed on
Mar 28, 2025
Sold by
Bowers Tammy B
Bought by
Bowers Paul E
Current Estimated Value
Purchase Details
Closed on
Feb 1, 2024
Sold by
South Albemarle Volunteer Fire Departmen and South Side Volunteer Fire Department Inc
Bought by
Bowers Paul E and Bowers Tammy B
Purchase Details
Closed on
Sep 30, 2019
Sold by
South Side Volunteer Fire Department Inc
Bought by
Bowers Paul E and Bowers Tammy B
Home Financials for this Owner
Home Financials are based on the most recent Mortgage that was taken out on this home.
Original Mortgage
$28,000
Interest Rate
3.6%
Mortgage Type
Commercial
Purchase Details
Closed on
Jan 1, 2012
Bought by
Southside No 1 Vol Fire Dpt
Create a Home Valuation Report for This Property
The Home Valuation Report is an in-depth analysis detailing your home's value as well as a comparison with similar homes in the area
Home Values in the Area
Average Home Value in this Area
Purchase History
| Date | Buyer | Sale Price | Title Company |
|---|---|---|---|
| Bowers Paul E | -- | None Listed On Document | |
| Bowers Paul E | -- | None Listed On Document | |
| Bowers Paul E | -- | None Listed On Document | |
| Bowers Paul E | $35,000 | None Available | |
| Southside No 1 Vol Fire Dpt | -- | -- |
Source: Public Records
Mortgage History
| Date | Status | Borrower | Loan Amount |
|---|---|---|---|
| Previous Owner | Bowers Paul E | $28,000 |
Source: Public Records
Tax History Compared to Growth
Tax History
| Year | Tax Paid | Tax Assessment Tax Assessment Total Assessment is a certain percentage of the fair market value that is determined by local assessors to be the total taxable value of land and additions on the property. | Land | Improvement |
|---|---|---|---|---|
| 2025 | $614 | $92,954 | $19,422 | $73,532 |
| 2024 | $535 | $70,352 | $8,467 | $61,885 |
| 2023 | $535 | $70,352 | $8,467 | $61,885 |
| 2022 | $595 | $70,352 | $8,467 | $61,885 |
| 2021 | $595 | $70,352 | $8,467 | $61,885 |
| 2020 | $564 | $59,916 | $7,552 | $52,364 |
| 2019 | $558 | $63,046 | $10,682 | $52,364 |
| 2018 | $564 | $63,046 | $10,682 | $52,364 |
| 2017 | $485 | $63,046 | $10,682 | $52,364 |
| 2016 | $490 | $63,625 | $10,034 | $53,591 |
| 2015 | -- | $63,625 | $10,034 | $53,591 |
| 2014 | -- | $63,625 | $10,034 | $53,591 |
Source: Public Records
Map
Nearby Homes
- 2119 Morgan Hills Dr
- 226 J P Dr
- Highway U S 52 Hwy S
- 00 Hastings Dr
- 0000 Stony Gap Rd
- 303 Ellenwood Dr
- 36315 Oakhurst Rd
- 593 Washington Ln
- 100 Boyette Dr Unit B
- 100 Boyette Dr Unit A
- 0000 N Carolina 73
- Vacant N Carolina 73
- 405 Aquadale Rd
- TBD State 24
- VAC State 24
- 0 Leonard Ave
- 1025 Freeman View Dr
- 27706 Taylor Ln
- 754 S 5th St
- 1003 Lundix St
- 37317 Southside Rd
- 24453 Us Highway 52 S
- 24325 Us Highway 52 S
- 37318 Southside Rd
- 24420 Us Highway 52 S
- 24291 Us 52 Hwy S
- 24459 S Business 52
- 24459 Us Highway 52 S
- 24460 S Business 52
- 24466 Us 52 Hwy S
- 24466 Us Highway 52 S
- 24466 U S 52
- 39221 Duck Rd
- 24466 S Business 52
- 39274 Duck Rd
- 39233 Duck Rd
- 0 Highway 52 Hwy S Unit 3189657
- 24472 S Business 52
- 24473 Us Highway 52 S
- 39257 Duck Rd