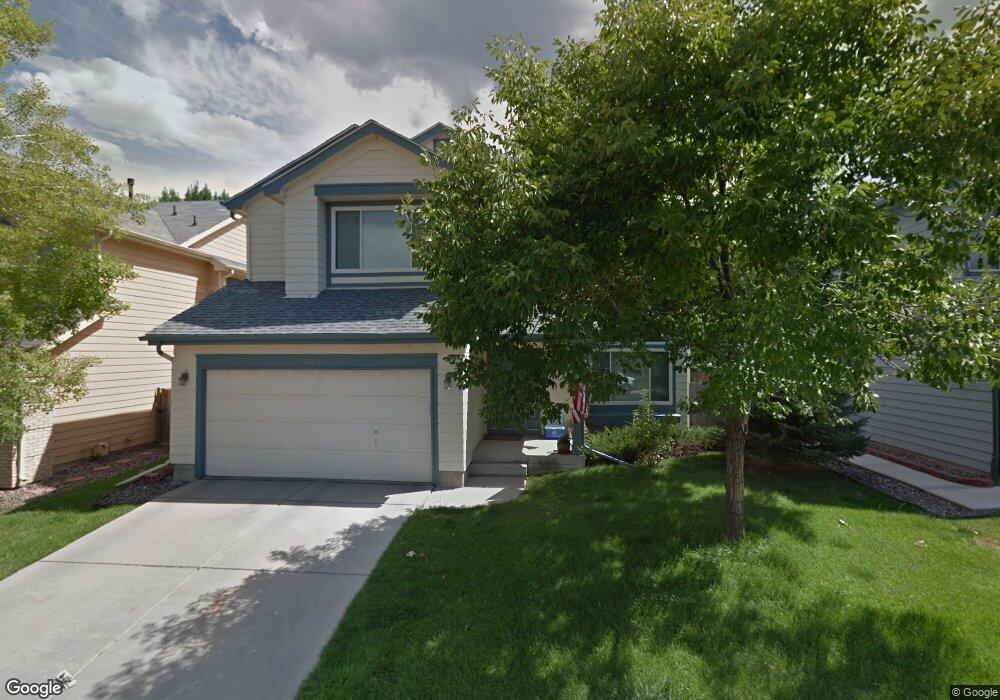
3962 Cambridge Ave Broomfield, CO 80020
Brandywine NeighborhoodEstimated Value: $583,425 - $658,000
3
Beds
3
Baths
2,304
Sq Ft
$266/Sq Ft
Est. Value
About This Home
This home is located at 3962 Cambridge Ave, Broomfield, CO 80020 and is currently estimated at $611,856, approximately $265 per square foot. 3962 Cambridge Ave is a home located in Broomfield County with nearby schools including Mountain View Elementary School, Westlake Middle School, and Legacy High School.
Ownership History
Date
Name
Owned For
Owner Type
Purchase Details
Closed on
Jan 1, 2017
Sold by
Patricoff Daniel Chase and Patricoff Diane M
Bought by
Thompson Joshua
Current Estimated Value
Home Financials for this Owner
Home Financials are based on the most recent Mortgage that was taken out on this home.
Original Mortgage
$275,000
Outstanding Balance
$226,883
Interest Rate
4.16%
Mortgage Type
VA
Estimated Equity
$384,973
Purchase Details
Closed on
Sep 9, 2009
Sold by
Lowe Curry Carey and Curry Jeff
Bought by
Patricoff Daniel Chase and Patricoff Diane M
Home Financials for this Owner
Home Financials are based on the most recent Mortgage that was taken out on this home.
Original Mortgage
$226,670
Interest Rate
5.26%
Mortgage Type
VA
Purchase Details
Closed on
Aug 14, 1998
Sold by
Lopez Jose L
Bought by
Lowe-Curry Carey And
Purchase Details
Closed on
Oct 7, 1994
Purchase Details
Closed on
Mar 23, 1993
Purchase Details
Closed on
Sep 1, 1992
Create a Home Valuation Report for This Property
The Home Valuation Report is an in-depth analysis detailing your home's value as well as a comparison with similar homes in the area
Home Values in the Area
Average Home Value in this Area
Purchase History
| Date | Buyer | Sale Price | Title Company |
|---|---|---|---|
| Thompson Joshua | $340,000 | First American | |
| Patricoff Daniel Chase | $221,900 | Land Title Guarantee Company | |
| Lowe-Curry Carey And | $157,000 | -- | |
| -- | $135,500 | -- | |
| -- | $116,100 | -- | |
| -- | $93,800 | -- |
Source: Public Records
Mortgage History
| Date | Status | Borrower | Loan Amount |
|---|---|---|---|
| Open | Thompson Joshua | $275,000 | |
| Previous Owner | Patricoff Daniel Chase | $226,670 |
Source: Public Records
Tax History Compared to Growth
Tax History
| Year | Tax Paid | Tax Assessment Tax Assessment Total Assessment is a certain percentage of the fair market value that is determined by local assessors to be the total taxable value of land and additions on the property. | Land | Improvement |
|---|---|---|---|---|
| 2025 | $4,072 | $39,470 | $9,050 | $30,420 |
| 2024 | $4,072 | $37,970 | $8,250 | $29,720 |
| 2023 | $4,035 | $43,210 | $9,380 | $33,830 |
| 2022 | $3,364 | $29,780 | $6,600 | $23,180 |
| 2021 | $3,468 | $30,630 | $6,790 | $23,840 |
| 2020 | $3,308 | $28,900 | $6,440 | $22,460 |
| 2019 | $3,310 | $29,100 | $6,480 | $22,620 |
| 2018 | $2,840 | $24,080 | $4,680 | $19,400 |
| 2017 | $2,587 | $26,610 | $5,170 | $21,440 |
| 2016 | $2,461 | $22,320 | $5,050 | $17,270 |
| 2015 | $2,461 | $17,880 | $5,050 | $12,830 |
| 2014 | $2,026 | $17,880 | $5,050 | $12,830 |
Source: Public Records
Map
Nearby Homes
- 3974 Cambridge Ave
- 3981 W 127th Ave
- 12545 Tammywood St
- 12450 Forest View St
- 12510 Newton St
- 12805 King St
- 12695 Wolff St
- 12620 Winona Ct
- 12205 Pery St
- 13005 Lowell Ct
- 12528 James Point
- 12639 James Ct
- 3465 W 125th Point
- 12217 Crabapple St
- 5005 W 128th Place
- 13010 King Cir
- 3414 W 126th Place
- 3202 Columbine Ct
- 3406 W 126th Dr
- 3422 W 125th Dr
- 3958 Cambridge Ave
- 3965 Primrose Ct
- 3980 Cambridge Ave
- 3944 Cambridge Ave
- 3951 Primrose Ct
- 3979 Primrose Ct
- 3961 Cambridge Ave
- 3947 Primrose Ct
- 3953 Cambridge Ave
- 3977 Cambridge Ave
- 3983 Cambridge Ave
- 3945 Cambridge Ave
- 12678 Patton St
- 3960 W 127th Ave
- 12674 Patton St
- 12682 Patton St
- 3978 Primrose Ct
- 3976 W 127th Ave
- 3952 W 127th Ave
- 12666 Patton St