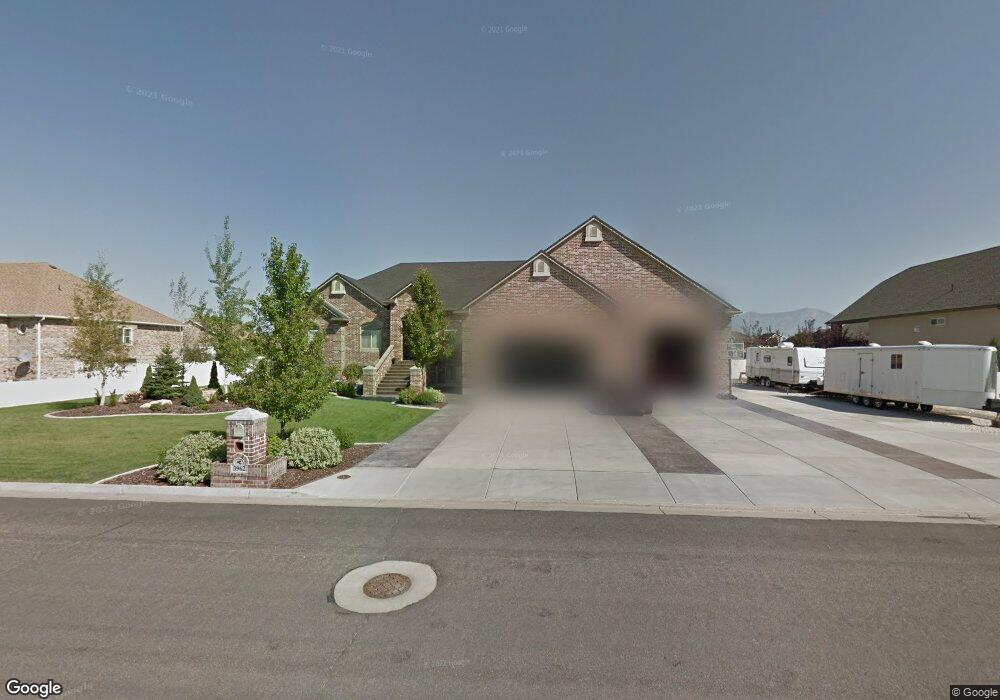
3962 W 4200 S West Haven, UT 84401
Estimated Value: $1,076,000 - $1,274,039
6
Beds
5
Baths
5,000
Sq Ft
$234/Sq Ft
Est. Value
About This Home
This home is located at 3962 W 4200 S, West Haven, UT 84401 and is currently estimated at $1,172,010, approximately $234 per square foot. 3962 W 4200 S is a home located in Weber County with nearby schools including West Haven School, Sand Ridge Junior High School, and Roy High School.
Ownership History
Date
Name
Owned For
Owner Type
Purchase Details
Closed on
Mar 18, 2020
Sold by
Wall Nicholas and Wall Whitney
Bought by
Wall Nicholas D and Wall Whitney
Current Estimated Value
Home Financials for this Owner
Home Financials are based on the most recent Mortgage that was taken out on this home.
Original Mortgage
$410,000
Outstanding Balance
$283,245
Interest Rate
3.4%
Mortgage Type
New Conventional
Estimated Equity
$888,765
Purchase Details
Closed on
Jul 29, 2014
Sold by
Visser Tab W and Visser Lisa M
Bought by
Wall Nicholas and Wall Whitney
Home Financials for this Owner
Home Financials are based on the most recent Mortgage that was taken out on this home.
Original Mortgage
$63,000
Interest Rate
4.13%
Mortgage Type
Credit Line Revolving
Purchase Details
Closed on
May 10, 2004
Sold by
Smith Richard B and Smith Janice R
Bought by
Visser Tab W and Visser Lisa M
Purchase Details
Closed on
May 30, 2002
Sold by
Kdr Llc
Bought by
Smith Richard B and Smith Janice R
Create a Home Valuation Report for This Property
The Home Valuation Report is an in-depth analysis detailing your home's value as well as a comparison with similar homes in the area
Home Values in the Area
Average Home Value in this Area
Purchase History
| Date | Buyer | Sale Price | Title Company |
|---|---|---|---|
| Wall Nicholas D | -- | Stewart Ttl Nsurance Agenncy | |
| Wall Nicholas | -- | North American Title | |
| Visser Tab W | -- | Cardon Land Title | |
| Smith Richard B | -- | Cardon Land Title |
Source: Public Records
Mortgage History
| Date | Status | Borrower | Loan Amount |
|---|---|---|---|
| Open | Wall Nicholas D | $410,000 | |
| Closed | Wall Nicholas | $63,000 | |
| Closed | Wall Nicholas | $417,000 |
Source: Public Records
Tax History Compared to Growth
Tax History
| Year | Tax Paid | Tax Assessment Tax Assessment Total Assessment is a certain percentage of the fair market value that is determined by local assessors to be the total taxable value of land and additions on the property. | Land | Improvement |
|---|---|---|---|---|
| 2025 | $6,992 | $1,098,702 | $249,914 | $848,788 |
| 2024 | $6,666 | $592,899 | $137,452 | $455,447 |
| 2023 | $6,429 | $573,100 | $137,453 | $435,647 |
| 2022 | $6,864 | $632,910 | $123,755 | $509,155 |
| 2021 | $5,533 | $844,000 | $129,800 | $714,200 |
| 2020 | $4,862 | $681,000 | $110,071 | $570,929 |
| 2019 | $4,970 | $668,000 | $91,913 | $576,087 |
| 2018 | $5,130 | $667,000 | $91,913 | $575,087 |
| 2017 | $4,543 | $570,629 | $92,049 | $478,580 |
| 2016 | $4,418 | $304,355 | $48,782 | $255,573 |
| 2015 | $4,306 | $294,931 | $51,528 | $243,403 |
| 2014 | $3,592 | $236,691 | $44,389 | $192,302 |
Source: Public Records
Map
Nearby Homes
- 3984 W 4000 S
- 4080 W 4000 S
- 3791 S 3750 W
- 4124 S 3560 W
- Villages Townhome Plan at Green Farm - Villages
- 3555 W 3900 S
- 3724 S 3650 W
- 4024 W 4650 S
- 3610 W 4475 S
- 3692 W 4625 S
- 3795 S 4250 W Unit D
- 3959 S 3485 W
- 3786 S 4250 W Unit A/ 427
- 3652 W 4625 S
- 4094 W 4700 S
- 3632 W 4650 S
- 3942 S 3450 W
- 4351 W 4000 S
- 4258 W 3775 S
- 3627 W 4650 S
- 3986 W 4200 S
- 3940 W 4200 S
- 4008 W 4200 S
- 3916 W 4200 S
- 3953 W 4100 S
- 3935 W 4100 S
- 3969 W 4100 S
- 4032 W 4200 S
- 4032 W 4200 S Unit 110
- 3987 W 4100 S
- 3917 W 4100 S
- 3958 W 4100 S
- 4102 S 4000 W
- 3950 W 4100 S
- 3970 W 4100 S
- 4056 W 4200 S
- 4138 S 4100 W
- 4138 S 4100 W Unit LOT 65
- 4225 S 3850 W
- 3990 W 4100 S