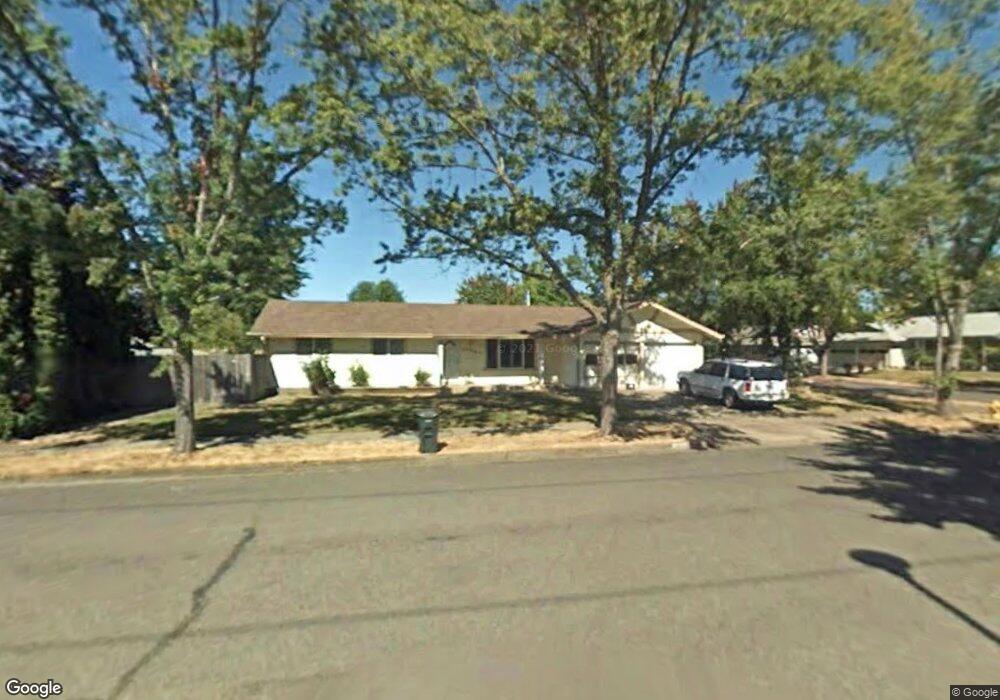
3963 Josh St Eugene, OR 97402
Churchill NeighborhoodEstimated Value: $342,000 - $378,437
3
Beds
1
Bath
1,032
Sq Ft
$352/Sq Ft
Est. Value
About This Home
This home is located at 3963 Josh St, Eugene, OR 97402 and is currently estimated at $363,359, approximately $352 per square foot. 3963 Josh St is a home located in Lane County with nearby schools including Twin Oaks Elementary School, Kennedy Middle School, and Churchill High School.
Ownership History
Date
Name
Owned For
Owner Type
Purchase Details
Closed on
Mar 3, 2021
Sold by
Canatsey Shane
Bought by
Canatsey Shane M and Canatsey Tiffany D
Current Estimated Value
Home Financials for this Owner
Home Financials are based on the most recent Mortgage that was taken out on this home.
Original Mortgage
$83,500
Outstanding Balance
$59,971
Interest Rate
2.2%
Mortgage Type
New Conventional
Estimated Equity
$303,388
Purchase Details
Closed on
Mar 24, 2003
Sold by
First Union National Bank
Bought by
Canatsey Shane
Home Financials for this Owner
Home Financials are based on the most recent Mortgage that was taken out on this home.
Original Mortgage
$108,202
Interest Rate
5.78%
Mortgage Type
FHA
Purchase Details
Closed on
Sep 30, 2002
Sold by
Suzuki Margaret M
Bought by
First Union National Bank
Purchase Details
Closed on
Nov 29, 1999
Sold by
Hong Phat Thanh
Bought by
Suzuki Margaret M
Home Financials for this Owner
Home Financials are based on the most recent Mortgage that was taken out on this home.
Original Mortgage
$93,600
Interest Rate
9.99%
Create a Home Valuation Report for This Property
The Home Valuation Report is an in-depth analysis detailing your home's value as well as a comparison with similar homes in the area
Home Values in the Area
Average Home Value in this Area
Purchase History
| Date | Buyer | Sale Price | Title Company |
|---|---|---|---|
| Canatsey Shane M | -- | Western Title | |
| Canatsey Shane | $109,900 | Western Pioneer Title | |
| First Union National Bank | $85,729 | Western Pioneer Title Co | |
| Suzuki Margaret M | $117,000 | Evergreen Land Title Company |
Source: Public Records
Mortgage History
| Date | Status | Borrower | Loan Amount |
|---|---|---|---|
| Open | Canatsey Shane M | $83,500 | |
| Previous Owner | Canatsey Shane | $108,202 | |
| Previous Owner | Suzuki Margaret M | $93,600 | |
| Closed | Suzuki Margaret M | $23,400 |
Source: Public Records
Tax History
| Year | Tax Paid | Tax Assessment Tax Assessment Total Assessment is a certain percentage of the fair market value that is determined by local assessors to be the total taxable value of land and additions on the property. | Land | Improvement |
|---|---|---|---|---|
| 2025 | $3,549 | $182,147 | -- | -- |
| 2024 | $3,505 | $176,842 | -- | -- |
| 2023 | $3,505 | $171,692 | $0 | $0 |
| 2022 | $3,283 | $166,692 | $0 | $0 |
| 2021 | $3,084 | $161,837 | $0 | $0 |
| 2020 | $3,095 | $157,124 | $0 | $0 |
| 2019 | $2,989 | $152,548 | $0 | $0 |
| 2018 | $2,813 | $143,791 | $0 | $0 |
| 2017 | $2,687 | $143,791 | $0 | $0 |
| 2016 | $2,602 | $139,603 | $0 | $0 |
| 2015 | $2,490 | $135,537 | $0 | $0 |
| 2014 | $2,441 | $131,589 | $0 | $0 |
Source: Public Records
Map
Nearby Homes
- 3958 Pam St
- 1625 S Bertelsen Rd
- 1415 S Bertelsen Rd Unit 96
- 1415 S Bertelsen Rd Unit 34
- 1415 S Bertelsen Rd Unit 143
- 1885 Churchill St
- 1925 Harvard Dr
- 1980 Princeton Dr
- 3705 Peppertree Dr
- 3534 Westleigh St
- 3823 Wilshire Ln
- 1438 Quaker St
- 1326 Quaker St
- 1580 Brittany St
- 3899 Colony Oaks Dr
- 4048 Eagle View Dr
- 2842 Greentree Way
- 3809 Colony Oaks Dr
- 3818 Colony Oaks Dr Unit 6
- 3379 S Lambert St
Your Personal Tour Guide
Ask me questions while you tour the home.