3963 Spica Way Lompoc, CA 93436
Estimated Value: $597,000 - $631,000
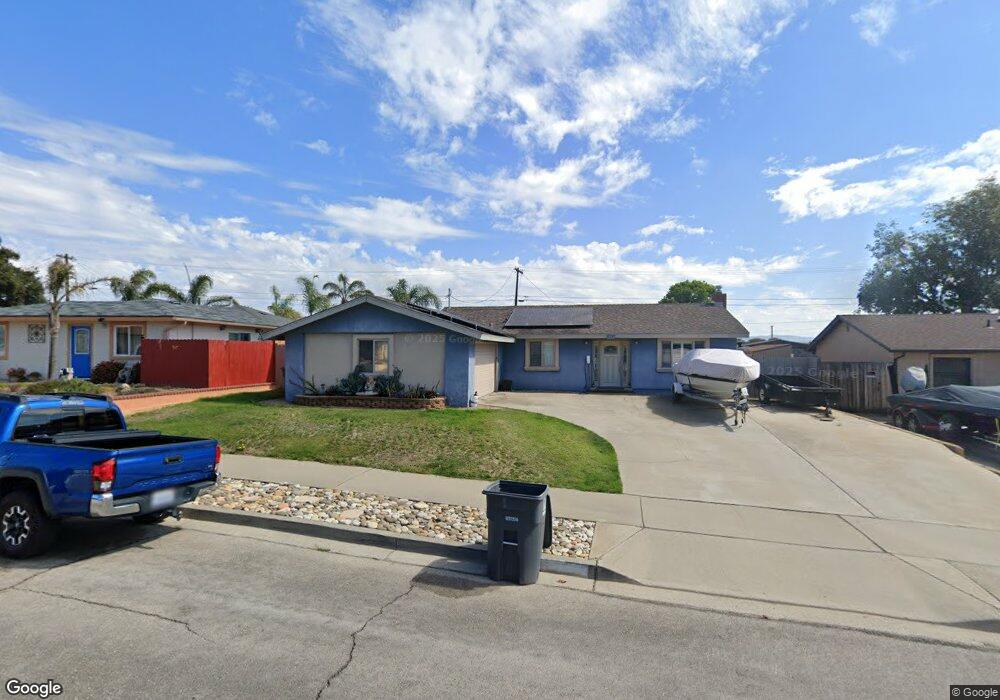
About This Home
This home is located at 3963 Spica Way, Lompoc, CA 93436 and is currently estimated at $615,854, approximately $471 per square foot. 3963 Spica Way is a home located in Santa Barbara County with nearby schools including Buena Vista Elementary School and Cabrillo High School.
Ownership History
We collect this data history from publicly available records. To have your information removed, we recommend requesting removal directly through your county’s website.
Purchase Details
Home Financials for this Owner
Home Financials are based on the most recent Mortgage that was taken out on this home.Purchase Details
Home Financials for this Owner
Home Financials are based on the most recent Mortgage that was taken out on this home.Purchase Details
Home Financials for this Owner
Home Financials are based on the most recent Mortgage that was taken out on this home.Purchase Details
Home Values in the Area
Average Home Value in this Area
Purchase History
We collect this data history from publicly available records. To have your information removed, we recommend requesting removal directly through your county’s website.
| Date | Buyer | Sale Price | Title Company |
|---|---|---|---|
| $300,000 | First American Title Company | ||
| $249,000 | First American Title | ||
| $200,000 | Stewart Title | ||
| -- | Stewart Title | ||
| -- | -- |
Mortgage History
We collect this data history from publicly available records. To have your information removed, we recommend requesting removal directly through your county’s website.
| Date | Status | Borrower | Loan Amount |
|---|---|---|---|
| Previous Owner | $273,071 | ||
| Previous Owner | $37,350 | ||
| Previous Owner | $199,200 | ||
| Previous Owner | $170,000 |
Tax History
We collect this data history from publicly available records. To have your information removed, we recommend requesting removal directly through your county’s website.
| Year | Tax Paid | Tax Assessment Tax Assessment Total Assessment is a certain percentage of the fair market value that is determined by local assessors to be the total taxable value of land and additions on the property. | Land | Improvement |
|---|---|---|---|---|
| 2025 | $4,197 | $355,133 | $118,377 | $236,756 |
| 2023 | $4,197 | $341,344 | $113,781 | $227,563 |
| 2022 | $4,133 | $334,651 | $111,550 | $223,101 |
| 2021 | $4,177 | $328,090 | $109,363 | $218,727 |
| 2020 | $4,135 | $324,727 | $108,242 | $216,485 |
| 2019 | $4,075 | $318,361 | $106,120 | $212,241 |
| 2018 | $4,018 | $312,120 | $104,040 | $208,080 |
| 2017 | $3,862 | $306,000 | $102,000 | $204,000 |
| 2016 | $3,526 | $300,000 | $100,000 | $200,000 |
| 2015 | $2,821 | $245,000 | $81,000 | $164,000 |
| 2014 | $2,694 | $233,000 | $77,000 | $156,000 |
Map
- 245 Burton Mesa Blvd
- 245 Burton Mesa Blvd Unit B
- 259 Burton Mesa Blvd Unit A
- 135 Oakmont Ave
- 277 Burton Mesa Blvd Unit B
- 288 Antares Ave
- 4220 Constellation Rd
- 4050 Saint Andrews Ct
- 3944 Mesa Circle Dr Unit A
- 4173 Oakwood Ct
- 40 Galaxy Way
- 3673 Constellation Rd
- 6 Stanford Cir
- 18 Stanford Cir
- 4603 Falcon Dr
- 384 Falcon Crest Dr
- 453 Milky Way
- 18 Galaxy Way
- 649 Burning Tree Way
- 444 Mars Ave
Ask me questions while you tour the home.