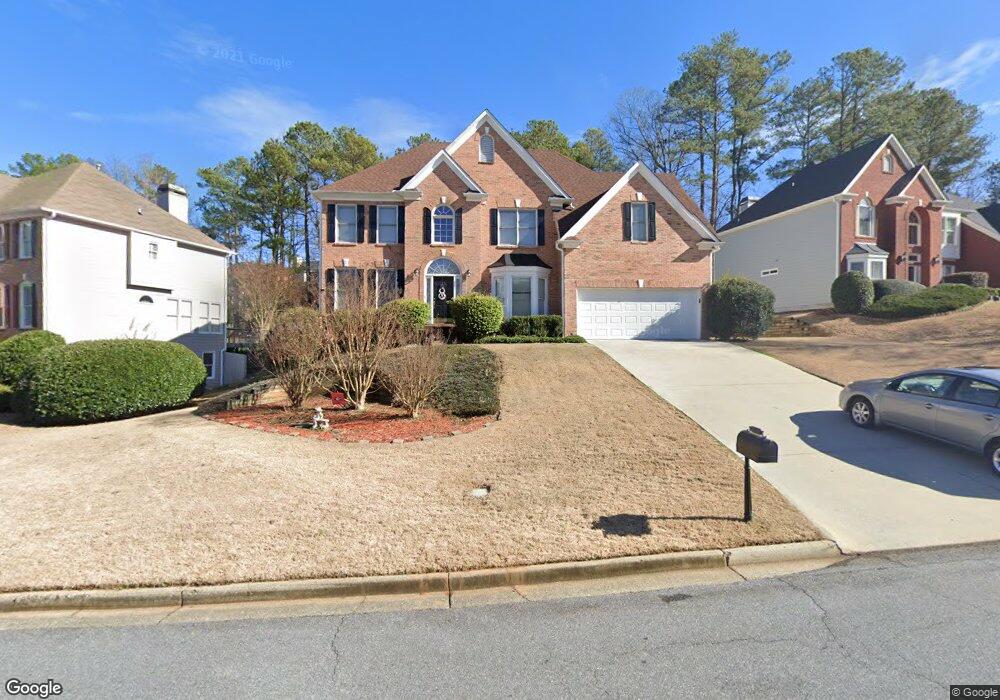
3963 Windgrove Crossing Unit 3 Suwanee, GA 30024
Estimated Value: $645,000 - $710,000
5
Beds
3
Baths
2,654
Sq Ft
$254/Sq Ft
Est. Value
About This Home
This home is located at 3963 Windgrove Crossing Unit 3, Suwanee, GA 30024 and is currently estimated at $672,994, approximately $253 per square foot. 3963 Windgrove Crossing Unit 3 is a home located in Gwinnett County with nearby schools including Suwanee Elementary School, North Gwinnett Middle School, and North Gwinnett High School.
Ownership History
Date
Name
Owned For
Owner Type
Purchase Details
Closed on
Jan 29, 2002
Sold by
Sorkin Paris
Bought by
Sorkin Paris and Sorkin Pamela
Current Estimated Value
Home Financials for this Owner
Home Financials are based on the most recent Mortgage that was taken out on this home.
Original Mortgage
$176,000
Outstanding Balance
$71,778
Interest Rate
7.16%
Mortgage Type
New Conventional
Estimated Equity
$601,216
Purchase Details
Closed on
Aug 29, 2000
Sold by
Hozman Ricardo and Hozman Claudia L
Bought by
Dennelly Robert M and Dennelly Dorothy A
Home Financials for this Owner
Home Financials are based on the most recent Mortgage that was taken out on this home.
Original Mortgage
$195,520
Interest Rate
8.11%
Mortgage Type
New Conventional
Purchase Details
Closed on
Mar 26, 1999
Sold by
Waterford Homes Inc
Bought by
Hozman Ricardo and Hozman Claudia L
Home Financials for this Owner
Home Financials are based on the most recent Mortgage that was taken out on this home.
Original Mortgage
$218,500
Interest Rate
6.82%
Mortgage Type
New Conventional
Create a Home Valuation Report for This Property
The Home Valuation Report is an in-depth analysis detailing your home's value as well as a comparison with similar homes in the area
Home Values in the Area
Average Home Value in this Area
Purchase History
| Date | Buyer | Sale Price | Title Company |
|---|---|---|---|
| Sorkin Paris | -- | -- | |
| Sorkin Paris | $250,000 | -- | |
| Dennelly Robert M | $244,400 | -- | |
| Hozman Ricardo | $229,900 | -- |
Source: Public Records
Mortgage History
| Date | Status | Borrower | Loan Amount |
|---|---|---|---|
| Open | Sorkin Paris | $176,000 | |
| Previous Owner | Dennelly Robert M | $195,520 | |
| Previous Owner | Hozman Ricardo | $218,500 |
Source: Public Records
Tax History Compared to Growth
Tax History
| Year | Tax Paid | Tax Assessment Tax Assessment Total Assessment is a certain percentage of the fair market value that is determined by local assessors to be the total taxable value of land and additions on the property. | Land | Improvement |
|---|---|---|---|---|
| 2025 | $7,216 | $285,440 | $44,080 | $241,360 |
| 2024 | $6,688 | $250,760 | $47,200 | $203,560 |
| 2023 | $6,688 | $239,120 | $47,200 | $191,920 |
| 2022 | $6,019 | $219,600 | $40,400 | $179,200 |
| 2021 | $4,887 | $160,640 | $29,720 | $130,920 |
| 2020 | $4,744 | $152,280 | $27,640 | $124,640 |
| 2019 | $4,624 | $152,280 | $27,640 | $124,640 |
| 2018 | $4,213 | $132,880 | $32,000 | $100,880 |
| 2016 | $3,937 | $119,120 | $28,000 | $91,120 |
| 2015 | $3,638 | $103,880 | $21,200 | $82,680 |
| 2014 | $3,656 | $103,880 | $21,200 | $82,680 |
Source: Public Records
Map
Nearby Homes
- 358 Rhodes House Ct
- 3720 Brookefall Landing
- 3713 Lake Edge Dr
- 407 Vista Lake Dr
- 3998 Oak Crossing Dr NE
- 3612 Brookefall Ct
- 3941 Oak Crossing Dr
- 4394 Austin Hills Dr Unit 1
- 4614 Austin Hills Dr
- 3720 Crescent Walk Ln
- 3740 Crescent Walk Ln
- 4244 Austin Hills Dr
- 366 Regal Pines Ct
- 4450 Woodward Walk Ln
- 4045 Hillcrest View Ct
- 4186 Terrace Oaks Ct
- 4071 Woodward Walk Ln
- 4154 Hawking Dr
- 4217 Heisenberg Ln
- 3983 Windgrove Crossing Unit 3
- 3953 Windgrove Crossing
- 3993 Windgrove Crossing Unit 3
- 3943 Windgrove Crossing Unit 3
- 3978 Windgrove Crossing
- 3730 Old Suwanee Rd
- 3720 Old Suwanee Rd
- 3740 Old Suwanee Rd
- 3968 Windgrove Crossing
- 4003 Windgrove Crossing Unit 3
- 3710 Old Suwanee Rd Unit 1
- 3750 Old Suwanee Rd Unit 1
- 3948 Windgrove Crossing
- 0 Windgrove Crossing Unit 7279777
- 0 Windgrove Crossing Unit 7231986
- 0 Windgrove Crossing Unit 8574444
- 0 Windgrove Crossing
- 457 Old Suwanee Rd
- 3700 Old Suwanee Rd
- 589 Havencrest Ct