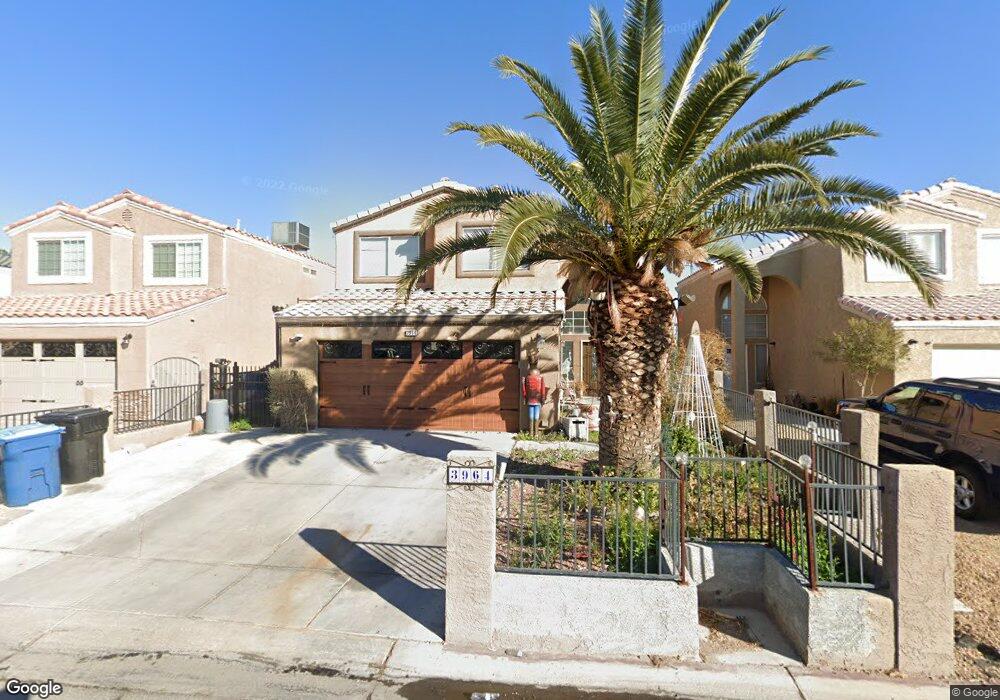
3964 Captain Jon Ave Las Vegas, NV 89104
Estimated Value: $404,000 - $462,000
4
Beds
3
Baths
2,011
Sq Ft
$210/Sq Ft
Est. Value
About This Home
This home is located at 3964 Captain Jon Ave, Las Vegas, NV 89104 and is currently estimated at $422,823, approximately $210 per square foot. 3964 Captain Jon Ave is a home located in Clark County with nearby schools including Walter V. Long Elementary School, Jerome Mack Middle School, and Chaparral High School.
Ownership History
Date
Name
Owned For
Owner Type
Purchase Details
Closed on
Aug 15, 2005
Sold by
Garcia Hector
Bought by
Garcia Hector and Garcia Linda
Current Estimated Value
Home Financials for this Owner
Home Financials are based on the most recent Mortgage that was taken out on this home.
Original Mortgage
$220,000
Outstanding Balance
$123,901
Interest Rate
6.8%
Mortgage Type
Unknown
Estimated Equity
$298,922
Purchase Details
Closed on
Aug 1, 2005
Sold by
Garcia Linda
Bought by
Garcia Hector
Home Financials for this Owner
Home Financials are based on the most recent Mortgage that was taken out on this home.
Original Mortgage
$220,000
Outstanding Balance
$123,901
Interest Rate
6.8%
Mortgage Type
Unknown
Estimated Equity
$298,922
Purchase Details
Closed on
May 11, 1994
Sold by
All American Construction Inc
Bought by
Garcia Hector and Garcia Linda
Home Financials for this Owner
Home Financials are based on the most recent Mortgage that was taken out on this home.
Original Mortgage
$124,745
Interest Rate
8.52%
Mortgage Type
FHA
Create a Home Valuation Report for This Property
The Home Valuation Report is an in-depth analysis detailing your home's value as well as a comparison with similar homes in the area
Home Values in the Area
Average Home Value in this Area
Purchase History
| Date | Buyer | Sale Price | Title Company |
|---|---|---|---|
| Garcia Hector | -- | Pacific Title | |
| Garcia Hector | -- | Pacific Title | |
| Garcia Hector | $127,500 | First American Title Company |
Source: Public Records
Mortgage History
| Date | Status | Borrower | Loan Amount |
|---|---|---|---|
| Open | Garcia Hector | $220,000 | |
| Closed | Garcia Hector | $124,745 |
Source: Public Records
Tax History Compared to Growth
Tax History
| Year | Tax Paid | Tax Assessment Tax Assessment Total Assessment is a certain percentage of the fair market value that is determined by local assessors to be the total taxable value of land and additions on the property. | Land | Improvement |
|---|---|---|---|---|
| 2025 | $1,303 | $79,339 | $22,750 | $56,589 |
| 2024 | $1,272 | $79,339 | $22,750 | $56,589 |
| 2023 | $1,272 | $79,498 | $25,550 | $53,948 |
| 2022 | $1,347 | $71,282 | $21,700 | $49,582 |
| 2021 | $1,247 | $67,311 | $19,950 | $47,361 |
| 2020 | $1,155 | $66,409 | $19,250 | $47,159 |
| 2019 | $1,083 | $62,910 | $16,450 | $46,460 |
| 2018 | $1,033 | $57,126 | $12,600 | $44,526 |
| 2017 | $1,632 | $55,633 | $10,500 | $45,133 |
| 2016 | $968 | $52,402 | $9,100 | $43,302 |
| 2015 | $965 | $42,155 | $7,000 | $35,155 |
| 2014 | $937 | $30,998 | $5,250 | $25,748 |
Source: Public Records
Map
Nearby Homes
- 1944 Randa Ln
- 4055 E New York Ave
- 2356 Grannis Ln
- 4170 E Baltimore Ave
- 1892 Miner Way
- 4120 E Cincinnati Ave
- 2278 Miner Way
- 4214 E Baltimore Ave
- 3887 Delling Ct
- 1601 S Sandhill Rd Unit 78
- 1601 S Sandhill Rd Unit 191
- 4324 E Saint Louis Ave
- 4057 Olive St
- 2038 Palm St Unit 407
- 2038 Palm St Unit 60
- 2038 Palm St Unit 427
- 2038 Palm St Unit 321
- 2038 Palm St Unit 298
- 2038 Palm St Unit 47
- 2038 Palm St Unit 81
- 3958 Captain Jon Ave
- 3970 Captain Jon Ave
- 3952 Captain Jon Ave
- 3976 Captain Jon Ave
- 3946 Captain Jon Ave
- 2127 Alisa Maria Way
- 3957 Captain Jon Ave
- 3940 Captain Jon Ave
- 3982 Captain Jon Ave
- 2137 Alisa Maria Way
- 3951 Captain Jon Ave
- 3951 Captain Jon Ave Unit n/a
- 2114 Alisa Maria Way
- 3945 Captain Jon Ave
- 3934 Captain Jon Ave
- 2147 Alisa Maria Way
- 2120 Alisa Maria Way
- 3939 Captain Jon Ave
- 2130 Alisa Maria Way
- 3928 Captain Jon Ave