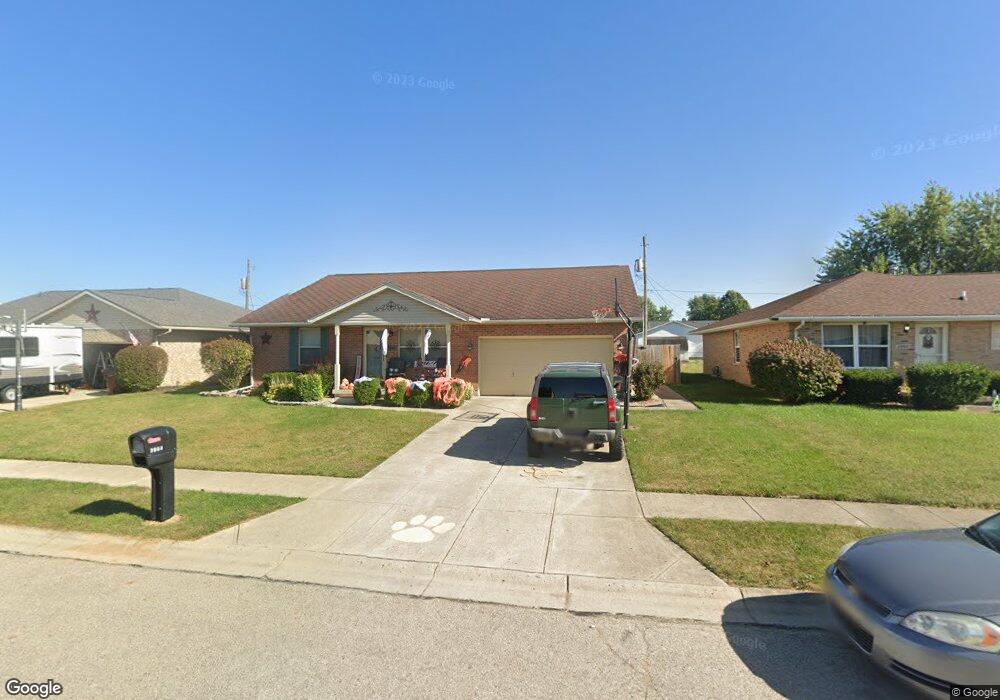
3964 Delmar Cir Springfield, OH 45503
Estimated Value: $255,000 - $286,876
3
Beds
3
Baths
1,555
Sq Ft
$178/Sq Ft
Est. Value
About This Home
This home is located at 3964 Delmar Cir, Springfield, OH 45503 and is currently estimated at $277,219, approximately $178 per square foot. 3964 Delmar Cir is a home located in Clark County with nearby schools including Northridge Elementary School, Kenton Ridge Middle & High School, and Emmanuel Christian Academy.
Ownership History
Date
Name
Owned For
Owner Type
Purchase Details
Closed on
Jun 18, 2021
Sold by
Willis Christina D and Young Christina D
Bought by
Young Christopher J
Current Estimated Value
Purchase Details
Closed on
Jan 25, 2012
Sold by
Stroble Kevin M and Stroble Leeann
Bought by
Young Christopher J and Young Christina D
Home Financials for this Owner
Home Financials are based on the most recent Mortgage that was taken out on this home.
Original Mortgage
$158,163
Interest Rate
3.93%
Mortgage Type
New Conventional
Purchase Details
Closed on
May 7, 1997
Sold by
Hoppes Dev Co
Bought by
Stroble Kevin M and Stroble Lee
Home Financials for this Owner
Home Financials are based on the most recent Mortgage that was taken out on this home.
Original Mortgage
$101,350
Interest Rate
8.05%
Mortgage Type
New Conventional
Create a Home Valuation Report for This Property
The Home Valuation Report is an in-depth analysis detailing your home's value as well as a comparison with similar homes in the area
Home Values in the Area
Average Home Value in this Area
Purchase History
| Date | Buyer | Sale Price | Title Company |
|---|---|---|---|
| Young Christopher J | -- | None Available | |
| Young Christopher J | -- | None Listed On Document | |
| Young Christopher J | $156,000 | Team Title & Closing Service | |
| Stroble Kevin M | $106,700 | -- |
Source: Public Records
Mortgage History
| Date | Status | Borrower | Loan Amount |
|---|---|---|---|
| Previous Owner | Young Christopher J | $158,163 | |
| Previous Owner | Stroble Kevin M | $101,350 |
Source: Public Records
Tax History
| Year | Tax Paid | Tax Assessment Tax Assessment Total Assessment is a certain percentage of the fair market value that is determined by local assessors to be the total taxable value of land and additions on the property. | Land | Improvement |
|---|---|---|---|---|
| 2025 | $2,823 | $88,880 | $12,090 | $76,790 |
| 2024 | $2,731 | $64,570 | $10,710 | $53,860 |
| 2023 | $2,731 | $64,570 | $10,710 | $53,860 |
| 2022 | $2,741 | $64,570 | $10,710 | $53,860 |
| 2021 | $2,683 | $53,570 | $8,310 | $45,260 |
| 2020 | $2,685 | $53,570 | $8,310 | $45,260 |
| 2019 | $2,736 | $53,570 | $8,310 | $45,260 |
| 2018 | $2,876 | $53,890 | $7,620 | $46,270 |
| 2017 | $2,466 | $50,061 | $7,616 | $42,445 |
| 2016 | $2,449 | $50,061 | $7,616 | $42,445 |
| 2015 | $2,347 | $49,841 | $7,396 | $42,445 |
| 2014 | $2,346 | $49,841 | $7,396 | $42,445 |
| 2013 | $2,292 | $49,841 | $7,396 | $42,445 |
Source: Public Records
Map
Nearby Homes
- 1921 Elaina Dr
- 3942 Harris Ln
- 1711 Pinehurst Dr
- 1811 Saint Andrews Ct
- 4256 Midfield St Unit 9
- 1503 Kingsgate Rd
- 1505 Kingsgate Rd
- 1507 Kingsgate Rd
- 1500 Kingsgate Rd
- 1502 Kingsgate Rd
- 1500 Kingsgate Rd Unit 19430
- 1502 Kingsgate Rd Unit 19432
- 1509 Kingsgate Rd
- 3631 Kingsgate Ln
- 4028 Ryland Dr Unit 4028
- 4446 Ridgewood Rd E Unit 3
- 1341 Student Ave
- 4577 Reno Ln Unit 2
- 1201 Kingsgate Rd
- 1162 Kingsgate Rd
- 3960 Delmar Cir
- 3968 Delmar Cir
- 3935 Kimberly Dr
- 3972 Delmar Cir
- 3929 Kimberly Dr
- 3941 Kimberly Dr
- 3956 Delmar Cir
- 3963 Delmar Cir
- 3923 Kimberly Dr
- 3947 Kimberly Dr
- 3967 Delmar Cir
- 3976 Delmar Cir
- 3951 Delmar Cir
- 3971 Delmar Cir
- 3917 Kimberly Dr
- 3953 Kimberly Dr
- 3952 Delmar Cir
- 3975 Delmar Cir
- 3980 Delmar Cir
- 3928 Delmar Cir
Your Personal Tour Guide
Ask me questions while you tour the home.