Estimated Value: $462,000 - $564,000
3
Beds
3
Baths
3,560
Sq Ft
$151/Sq Ft
Est. Value
About This Home
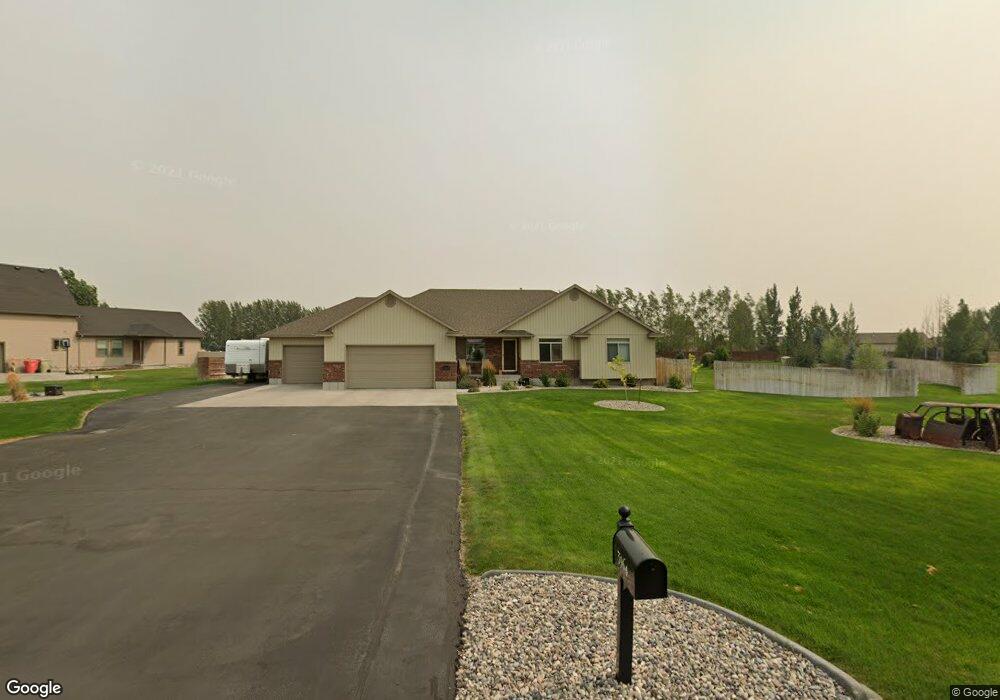
This home is located at 3964 E 160 N, Rigby, ID 83442 and is currently estimated at $535,968, approximately $150 per square foot. 3964 E 160 N is a home located in Jefferson County with nearby schools including Jefferson Elementary School, Rigby Middle School, and Rigby High School.
Ownership History
Date
Name
Owned For
Owner Type
Purchase Details
Closed on
Jul 23, 2008
Sold by
Hanson Myrle T
Bought by
Bruce Harold Greg and Bruce Pamela J
Current Estimated Value
Home Financials for this Owner
Home Financials are based on the most recent Mortgage that was taken out on this home.
Original Mortgage
$176,000
Outstanding Balance
$113,450
Interest Rate
6.31%
Mortgage Type
New Conventional
Estimated Equity
$422,518
Purchase Details
Closed on
Jan 10, 2007
Sold by
Hanson Julia and Hanson Myrle T
Bought by
Hanson Myrle T
Home Financials for this Owner
Home Financials are based on the most recent Mortgage that was taken out on this home.
Original Mortgage
$225,700
Interest Rate
6.12%
Mortgage Type
Unknown
Create a Home Valuation Report for This Property
The Home Valuation Report is an in-depth analysis detailing your home's value as well as a comparison with similar homes in the area
Home Values in the Area
Average Home Value in this Area
Purchase History
| Date | Buyer | Sale Price | Title Company |
|---|---|---|---|
| Bruce Harold Greg | -- | -- | |
| Hanson Myrle T | -- | First American Title C |
Source: Public Records
Mortgage History
| Date | Status | Borrower | Loan Amount |
|---|---|---|---|
| Open | Bruce Harold Greg | $176,000 | |
| Previous Owner | Hanson Myrle T | $225,700 |
Source: Public Records
Tax History
| Year | Tax Paid | Tax Assessment Tax Assessment Total Assessment is a certain percentage of the fair market value that is determined by local assessors to be the total taxable value of land and additions on the property. | Land | Improvement |
|---|---|---|---|---|
| 2025 | $1,117 | $529,717 | $0 | $0 |
| 2024 | $1,117 | $526,830 | $0 | $0 |
| 2023 | $1,741 | $528,418 | $0 | $0 |
| 2022 | $2,397 | $463,616 | $0 | $0 |
| 2021 | $2,264 | $365,213 | $0 | $0 |
| 2020 | $1,617 | $305,299 | $0 | $0 |
| 2019 | $1,717 | $265,994 | $0 | $0 |
| 2018 | $1,468 | $232,750 | $0 | $0 |
| 2017 | $1,361 | $218,171 | $0 | $0 |
| 2016 | $1,356 | $115,878 | $0 | $0 |
| 2015 | $1,329 | $109,244 | $0 | $0 |
| 2014 | $1,357 | $111,382 | $0 | $0 |
| 2013 | -- | $92,918 | $0 | $0 |
Source: Public Records
Map
Nearby Homes
Your Personal Tour Guide
Ask me questions while you tour the home.