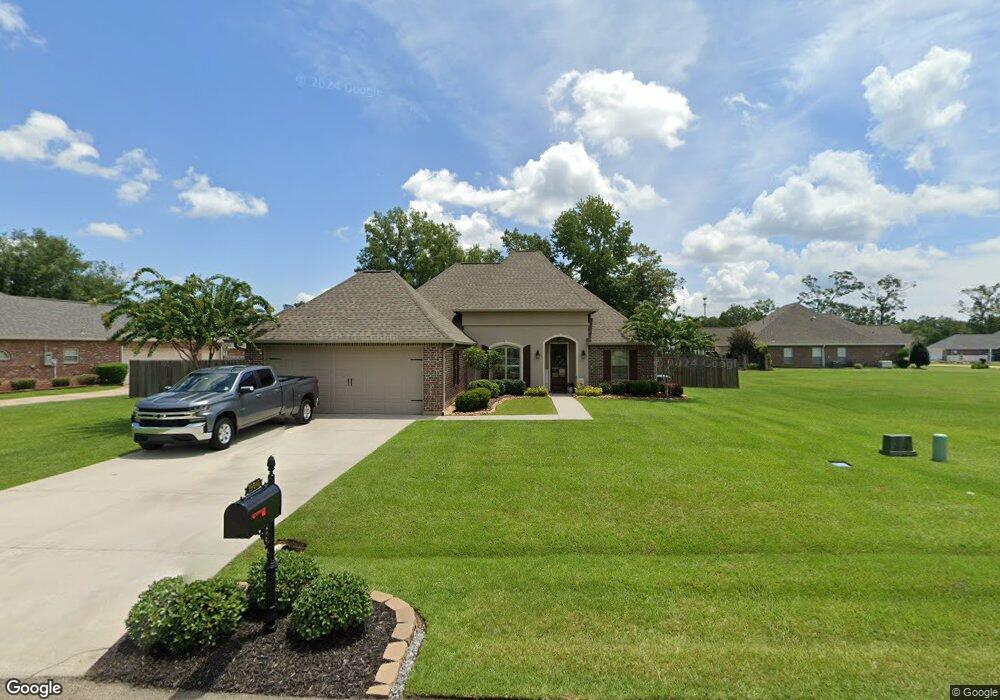
39646 W Tiger Loop Ponchatoula, LA 70454
Estimated Value: $301,164 - $355,000
Studio
--
Bath
2,613
Sq Ft
$126/Sq Ft
Est. Value
About This Home
This home is located at 39646 W Tiger Loop, Ponchatoula, LA 70454 and is currently estimated at $329,041, approximately $125 per square foot. 39646 W Tiger Loop is a home located in Tangipahoa Parish with nearby schools including Perrin Early Learning Center, Tucker Memorial Elementary School, and D.C. Reeves Elementary School.
Ownership History
Date
Name
Owned For
Owner Type
Purchase Details
Closed on
Nov 4, 2021
Sold by
Chase Tucker Ryan and Kraft Ciara
Bought by
Davises Thompson Robin and Davises Sean Thompson
Current Estimated Value
Home Financials for this Owner
Home Financials are based on the most recent Mortgage that was taken out on this home.
Original Mortgage
$259,250
Outstanding Balance
$234,645
Interest Rate
2.88%
Mortgage Type
New Conventional
Estimated Equity
$94,396
Purchase Details
Closed on
Jan 15, 2021
Sold by
Miller & Larpenter Llc
Bought by
Tucker Ryan C and Kraft-Tucker Coara
Purchase Details
Closed on
Nov 4, 2016
Sold by
Kay Ray Construction Llc
Bought by
Tucker Ryan Chase
Purchase Details
Closed on
Jul 1, 2016
Sold by
Miller & Larpenter Llc
Bought by
Kay Ray Construction Llc
Create a Home Valuation Report for This Property
The Home Valuation Report is an in-depth analysis detailing your home's value as well as a comparison with similar homes in the area
Home Values in the Area
Average Home Value in this Area
Purchase History
| Date | Buyer | Sale Price | Title Company |
|---|---|---|---|
| Davises Thompson Robin | $305,000 | None Listed On Document | |
| Tucker Ryan C | $49,000 | None Available | |
| Tucker Ryan Chase | $227,900 | Cook Title | |
| Kay Ray Construction Llc | $42,500 | First American Title |
Source: Public Records
Mortgage History
| Date | Status | Borrower | Loan Amount |
|---|---|---|---|
| Open | Davises Thompson Robin | $259,250 |
Source: Public Records
Tax History
| Year | Tax Paid | Tax Assessment Tax Assessment Total Assessment is a certain percentage of the fair market value that is determined by local assessors to be the total taxable value of land and additions on the property. | Land | Improvement |
|---|---|---|---|---|
| 2025 | $2,271 | $21,177 | $3,780 | $17,397 |
| 2024 | $2,249 | $21,177 | $3,780 | $17,397 |
| 2023 | $2,249 | $20,897 | $3,500 | $17,397 |
| 2022 | $2,217 | $20,897 | $3,500 | $17,397 |
| 2021 | $1,426 | $20,897 | $3,500 | $17,397 |
| 2020 | $2,216 | $20,897 | $3,500 | $17,397 |
| 2019 | $2,232 | $20,897 | $3,500 | $17,397 |
| 2018 | $2,280 | $20,897 | $3,500 | $17,397 |
| 2017 | $2,217 | $20,897 | $3,500 | $17,397 |
| 2016 | $91 | $850 | $850 | $0 |
| 2015 | $92 | $850 | $850 | $0 |
| 2014 | $86 | $850 | $850 | $0 |
Source: Public Records
Map
Nearby Homes
- 39776 Rou Mar Nei Dr
- 14689 Madison Ln
- 14664 Cypress Hollow Dr
- 14657 Madison Ln
- 15511 Patricks Dr
- 16143 W Murray Rd
- 0 U S Highway 51
- 16040 W Murray Rd
- 39797 River Oaks Dr
- 39599 Interstate 55 Service Rd
- 16116 W Murray Rd
- 0 U S 51
- 39301 Franklin St
- 40216 Hendrix Ln
- 41002 Waxmyrtle Rd
- 175 SE Service Rd
- 1221 U S Highway 51
- 0 Pelican Park Drive Dr Unit 2337744
- 0 Pelican Park Drive Dr Unit 2337790
- 0 Pelican Park Drive Dr Unit 2337773
- 39658 W Tiger Loop
- 15251 Maplewood Dr
- 15248 N Tiger Loop
- 39668 W Tiger Loop
- 39668 W Tiger Loop None
- 0 Maplewood Dr
- 15241 Maplewood Dr
- 15258 N Tiger Loop
- 15261 Maplewood Dr
- 15276 N Tiger Loop
- 39629 W Tiger Loop
- 39629 W Tiger Loop Other
- 39671 W Tiger Loop
- 39653 W Tiger Loop
- 39641 W Tiger Loop
- 15244 Maplewood Dr
- 39617 W Tiger Loop
- 0 Maplewood None
- 0 N Tiger Loop
- 15268 N Tiger Loop
Your Personal Tour Guide
Ask me questions while you tour the home.