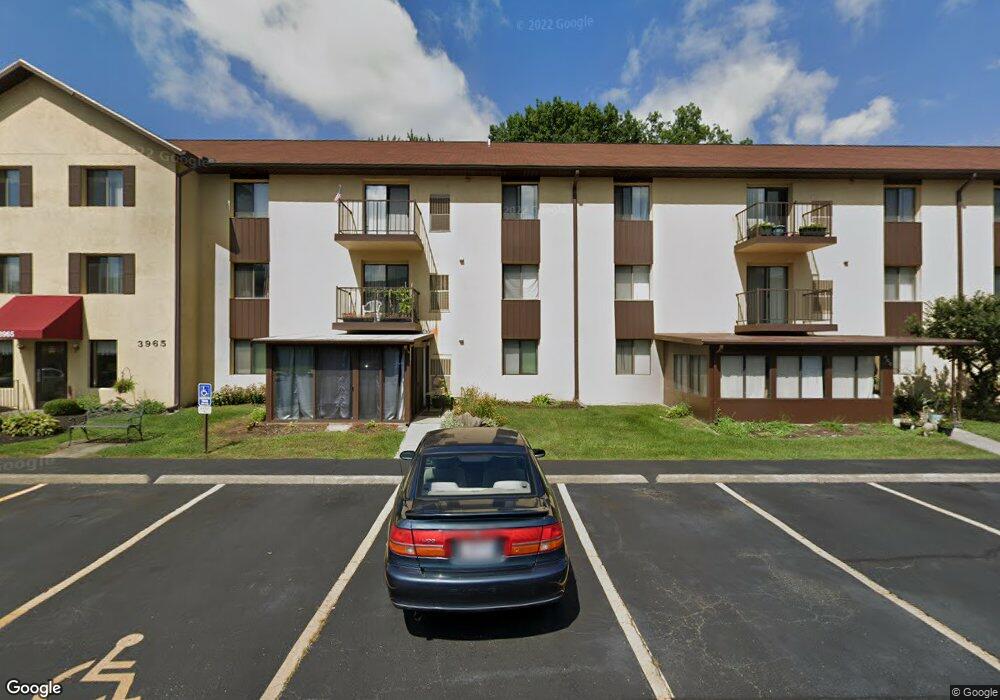
3965 Karl Rd Unit 307 Columbus, OH 43224
Clinton Estates NeighborhoodEstimated Value: $84,000 - $102,000
2
Beds
2
Baths
966
Sq Ft
$96/Sq Ft
Est. Value
About This Home
This home is located at 3965 Karl Rd Unit 307, Columbus, OH 43224 and is currently estimated at $92,274, approximately $95 per square foot. 3965 Karl Rd Unit 307 is a home located in Franklin County with nearby schools including Maize Road Elementary School, Medina Middle School, and Mifflin High School.
Ownership History
Date
Name
Owned For
Owner Type
Purchase Details
Closed on
May 28, 2020
Sold by
Lodder Ann T and Lodder John R
Bought by
Sanscrainte Richard
Current Estimated Value
Purchase Details
Closed on
Sep 3, 2010
Sold by
Lodder Inc
Bought by
Lodder John R and Lodder Ann T
Purchase Details
Closed on
May 27, 2010
Sold by
Wallace Wade and Estate Of Linda Mccormick
Bought by
Lodder Inc
Purchase Details
Closed on
Apr 3, 1998
Sold by
Weakley Elizabeth J and Estate Of Betty M Weakley
Bought by
Mccormick Linda
Purchase Details
Closed on
Sep 5, 1997
Sold by
Strickland Lisa Eve and Estate Of Kathryn Irene Hickey
Bought by
Weakley Betty M
Home Financials for this Owner
Home Financials are based on the most recent Mortgage that was taken out on this home.
Original Mortgage
$28,500
Interest Rate
7.44%
Purchase Details
Closed on
Nov 17, 1989
Create a Home Valuation Report for This Property
The Home Valuation Report is an in-depth analysis detailing your home's value as well as a comparison with similar homes in the area
Home Values in the Area
Average Home Value in this Area
Purchase History
| Date | Buyer | Sale Price | Title Company |
|---|---|---|---|
| Sanscrainte Richard | $50,500 | Northwest Select Title | |
| Lodder John R | -- | Stewart Tit | |
| Lodder Inc | $30,000 | Real Living | |
| Mccormick Linda | $46,000 | Chicago Title | |
| Weakley Betty M | $48,500 | Stewart Title Agency Of Colu | |
| -- | -- | -- |
Source: Public Records
Mortgage History
| Date | Status | Borrower | Loan Amount |
|---|---|---|---|
| Previous Owner | Weakley Betty M | $28,500 |
Source: Public Records
Tax History Compared to Growth
Tax History
| Year | Tax Paid | Tax Assessment Tax Assessment Total Assessment is a certain percentage of the fair market value that is determined by local assessors to be the total taxable value of land and additions on the property. | Land | Improvement |
|---|---|---|---|---|
| 2024 | $1,202 | $26,780 | $4,380 | $22,400 |
| 2023 | $1,187 | $26,775 | $4,375 | $22,400 |
| 2022 | $701 | $13,510 | $1,890 | $11,620 |
| 2021 | $702 | $13,510 | $1,890 | $11,620 |
| 2020 | $720 | $13,510 | $1,890 | $11,620 |
| 2019 | $622 | $10,010 | $1,400 | $8,610 |
| 2018 | $605 | $10,010 | $1,400 | $8,610 |
| 2017 | $635 | $10,010 | $1,400 | $8,610 |
| 2016 | $647 | $9,530 | $1,790 | $7,740 |
| 2015 | $589 | $9,530 | $1,790 | $7,740 |
| 2014 | $591 | $9,530 | $1,790 | $7,740 |
| 2013 | $364 | $11,900 | $2,240 | $9,660 |
Source: Public Records
Map
Nearby Homes
- 3939 Karl Rd Unit 108
- 3941 Karl Rd Unit 326
- 1440 E Cooke Rd
- 4057 Estates Place
- 1496 E Cooke Rd
- 4143 Karl Rd Unit 314
- 4145 Karl Rd Unit 4222
- 4145 Karl Rd Unit 223
- 3749 Ganson Dr
- 1398 Matthias Dr
- 1734 Ferris Rd
- 1507 Elmore Ave
- 1130 Carbone Dr
- 1064 Hillsdale Dr
- 3750 Dresden St
- 3585 Gerbert Rd
- 958 Janet Dr
- 3938 Eisenhower Rd
- 3583 Dresden St
- 3519 Gerbert Rd
- 3965 Karl Rd
- 3965 Karl Rd Unit 113
- 3965 Karl Rd Unit 204
- 3965 Karl Rd
- 3965 Karl Rd Unit 205
- 3965 Karl Rd Unit 201
- 3965 Karl Rd Unit 209
- 3965 Karl Rd Unit 311
- 3965 Karl Rd Unit 309
- 3965 Karl Rd Unit 210
- 3965 Karl Rd Unit 108
- 3965 Karl Rd Unit 211
- 3965 Karl Rd
- 3965 Karl Rd
- 3965 Karl Rd Unit 314
- 3965 Karl Rd Unit 300
- 3965 Karl Rd Unit 109
- 3965 Karl Rd
- 3965 Karl Rd
- 3965 Karl Rd