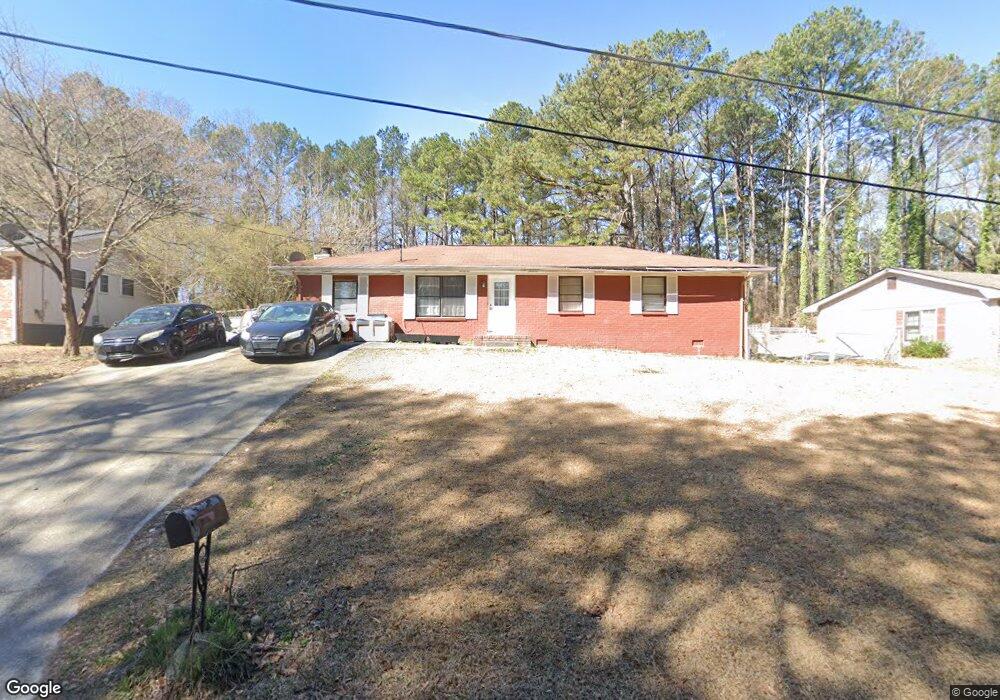
3965 Magnolia Ln Forest Park, GA 30297
Estimated Value: $143,000 - $195,682
3
Beds
2
Baths
1,092
Sq Ft
$155/Sq Ft
Est. Value
About This Home
This home is located at 3965 Magnolia Ln, Forest Park, GA 30297 and is currently estimated at $169,171, approximately $154 per square foot. 3965 Magnolia Ln is a home located in Clayton County with nearby schools including Huie Elementary School, Forest Park Middle School, and Forest Park High School.
Ownership History
Date
Name
Owned For
Owner Type
Purchase Details
Closed on
Nov 3, 2021
Sold by
Arias Yrma
Bought by
Leona Grp Llc
Current Estimated Value
Purchase Details
Closed on
May 2, 2014
Sold by
Disla Jose
Bought by
Arias Yrma
Purchase Details
Closed on
Mar 1, 2010
Sold by
Hernandez Jose
Bought by
Disla Jose
Purchase Details
Closed on
Dec 15, 2009
Sold by
Disla Jose
Bought by
Hernandez Jose
Purchase Details
Closed on
Nov 25, 2008
Sold by
Federal National Mortgage Association
Bought by
Disla Jose
Purchase Details
Closed on
Mar 4, 2008
Sold by
Ayala Enoes
Bought by
Suntrust Mortgage Inc
Purchase Details
Closed on
Mar 31, 2006
Sold by
Leveda Ann Smith Estate
Bought by
Ayala Enoes
Home Financials for this Owner
Home Financials are based on the most recent Mortgage that was taken out on this home.
Original Mortgage
$98,900
Interest Rate
6.2%
Mortgage Type
New Conventional
Create a Home Valuation Report for This Property
The Home Valuation Report is an in-depth analysis detailing your home's value as well as a comparison with similar homes in the area
Home Values in the Area
Average Home Value in this Area
Purchase History
| Date | Buyer | Sale Price | Title Company |
|---|---|---|---|
| Leona Grp Llc | -- | -- | |
| Arias Yrma | -- | -- | |
| Disla Jose | -- | -- | |
| Hernandez Jose | -- | -- | |
| Disla Jose | -- | -- | |
| Suntrust Mortgage Inc | $81,614 | -- | |
| Ayala Enoes | $98,900 | -- |
Source: Public Records
Mortgage History
| Date | Status | Borrower | Loan Amount |
|---|---|---|---|
| Previous Owner | Ayala Enoes | $98,900 |
Source: Public Records
Tax History Compared to Growth
Tax History
| Year | Tax Paid | Tax Assessment Tax Assessment Total Assessment is a certain percentage of the fair market value that is determined by local assessors to be the total taxable value of land and additions on the property. | Land | Improvement |
|---|---|---|---|---|
| 2024 | $2,298 | $58,000 | $6,400 | $51,600 |
| 2023 | $1,898 | $52,560 | $6,400 | $46,160 |
| 2022 | $1,694 | $42,280 | $6,400 | $35,880 |
| 2021 | $1,454 | $35,920 | $6,400 | $29,520 |
| 2020 | $1,259 | $30,611 | $6,400 | $24,211 |
| 2019 | $1,187 | $28,381 | $3,200 | $25,181 |
| 2018 | $994 | $23,621 | $3,200 | $20,421 |
| 2017 | $860 | $20,286 | $3,200 | $17,086 |
| 2016 | $850 | $20,023 | $3,200 | $16,823 |
| 2015 | $760 | $0 | $0 | $0 |
| 2014 | $575 | $13,570 | $3,200 | $10,370 |
Source: Public Records
Map
Nearby Homes
- 3881 Bonnie Ln SE
- 3975 Scott Dr
- 4082 Sweetbriar Ln
- 3970 Scott Dr
- 3851 Bonnie Ln SE
- 0 Jonesboro Rd Unit 20166054
- 4031 Browne Ct
- 996 Forest Valley Dr SE
- 1497 Conley Way
- 4170 Thurman Rd
- 1054 MacKets Ct SE
- 4156 Boling Dr
- 3688 Chevington Ct SE
- 1216 Erica Way SE
- 1220 Erica Way SE
- 766 Cascade Dr
- 1112 Evelyn Dr
- 1044 Rocksprings St
- 3973 Magnolia Ln Unit II
- 3955 Magnolia Ln
- 3981 Magnolia Ln
- 3979 Leslie Dr
- 3989 Magnolia Ln
- 3997 Magnolia Ln
- 3955 Enoch Dr
- 3961 Enoch Dr
- 3947 Magnolia Ln
- 3985 Leslie Dr Unit 3
- 3985 Leslie Dr
- 3947 Enoch Dr
- 3941 Magnolia Ln
- 3969 Enoch Dr Unit 4
- 3941 Enoch Dr Unit 4
- 4005 Magnolia Ln
- 3933 Enoch Dr Unit 4
- 3977 Enoch Dr Unit 4
- 3993 Leslie Dr Unit 1
- 3925 Enoch Dr Unit 4