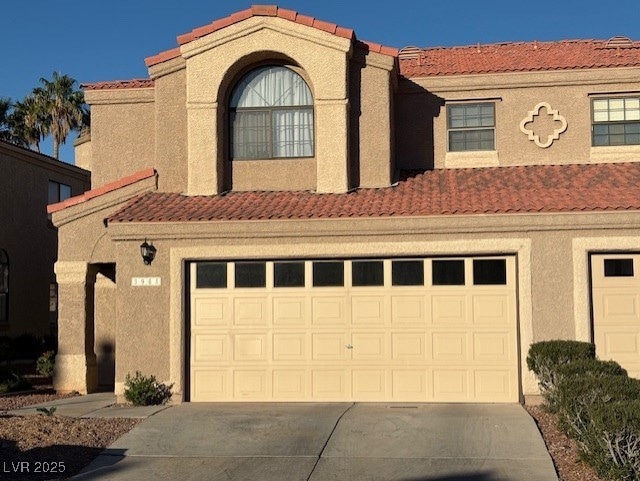


3965 Tirana Way Unit 3 Las Vegas, NV 89103
Estimated payment $2,584/month
Highlights
- RV Parking in Community
- Gated Community
- Tennis Courts
- Ed W Clark High School Rated A-
- Community Pool
- 2 Car Attached Garage
About This Home
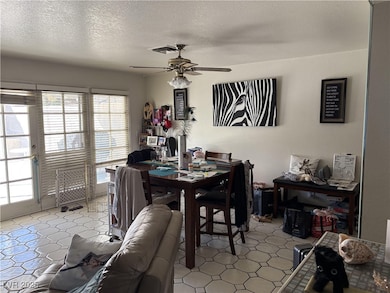
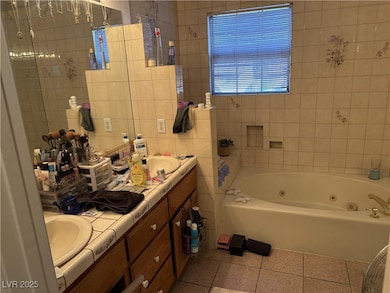
Step into the potential of refined living in Flamingo Heights. This spacious 3-bedroom patio home spans nearly 2,000 square feet and features soaring vaulted ceilings, an inviting open floor plan, and a rare double garage. The home’s generous layout and solid structure provide an ideal canvas for a sophisticated remodel—transforming it into a true Las Vegas showcase residence.
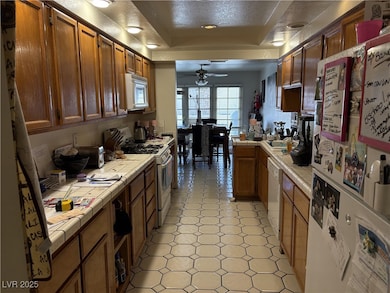
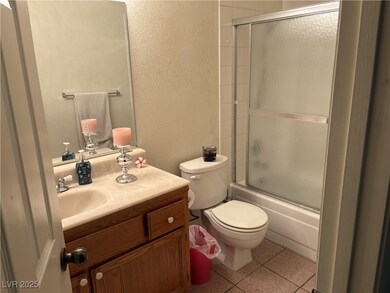
Imagine a modern chef’s kitchen, spa-inspired primary suite, and seamless indoor-outdoor flow—perfect for entertaining or quiet evenings at home. Nestled within a well-established community, this home combines privacy and convenience, just moments from upscale shopping, dining, and the energy of the Las Vegas Strip.
Whether you’re an investor with vision or a buyer seeking a luxury renovation opportunity, this property offers the foundation for something truly exceptional
Listing Agent
Show Vegas Realty Brokerage Phone: (702) 793-7672 License #S.0175053 Listed on: 10/30/2025
Townhouse Details
Home Type
- Townhome
Est. Annual Taxes
- $1,834
Year Built
- Built in 1988
Lot Details
- 2,500 Sq Ft Lot
- East Facing Home
- Back Yard Fenced
- Block Wall Fence
- Desert Landscape
HOA Fees
- $298 Monthly HOA Fees
Parking
- 2 Car Attached Garage
- Parking Storage or Cabinetry
- Inside Entrance
- Garage Door Opener
- Guest Parking
Home Design
- Tile Roof
Interior Spaces
- 1,964 Sq Ft Home
- 2-Story Property
- Wood Burning Fireplace
- Solar Screens
- Family Room with Fireplace
- Security System Owned
Kitchen
- Built-In Electric Oven
- Gas Range
- Microwave
- Disposal
Flooring
- Carpet
- Tile
Bedrooms and Bathrooms
- 3 Bedrooms
Laundry
- Laundry on main level
- Dryer
- Washer
Schools
- Decker Elementary School
- Guinn Kenny C. Middle School
- Clark Ed. W. High School
Utilities
- Central Heating and Cooling System
- Heating System Uses Gas
Community Details
Overview
- Association fees include sewer
- Flamingo Heights Association, Phone Number (702) 368-4637
- Flamingo Heights Phase 9 Subdivision
- The community has rules related to covenants, conditions, and restrictions
- RV Parking in Community
Recreation
- Tennis Courts
- Community Pool
- Community Spa
Pet Policy
- Pets Allowed with Restrictions
Additional Features
- Community Barbecue Grill
- Gated Community
Map
Home Values in the Area
Average Home Value in this Area
Tax History
| Year | Tax Paid | Tax Assessment Tax Assessment Total Assessment is a certain percentage of the fair market value that is determined by local assessors to be the total taxable value of land and additions on the property. | Land | Improvement |
|---|---|---|---|---|
| 2025 | $1,834 | $84,270 | $36,750 | $47,520 |
| 2024 | $1,699 | $84,270 | $36,750 | $47,520 |
| 2023 | $1,699 | $81,033 | $36,750 | $44,283 |
| 2022 | $1,573 | $70,054 | $27,650 | $42,404 |
| 2021 | $1,457 | $59,934 | $25,200 | $34,734 |
| 2020 | $1,350 | $61,735 | $25,200 | $36,535 |
| 2019 | $1,265 | $60,195 | $23,450 | $36,745 |
| 2018 | $1,207 | $49,073 | $13,650 | $35,423 |
| 2017 | $1,416 | $48,270 | $12,600 | $35,670 |
| 2016 | $1,131 | $45,516 | $9,450 | $36,066 |
| 2015 | $1,128 | $44,284 | $8,750 | $35,534 |
| 2014 | $1,093 | $36,153 | $8,750 | $27,403 |
Property History
| Date | Event | Price | List to Sale | Price per Sq Ft |
|---|---|---|---|---|
| 10/30/2025 10/30/25 | For Sale | $405,000 | -- | $206 / Sq Ft |
Purchase History
| Date | Type | Sale Price | Title Company |
|---|---|---|---|
| Interfamily Deed Transfer | -- | None Available | |
| Bargain Sale Deed | $158,000 | First American Title Company | |
| Interfamily Deed Transfer | $116,030 | -- | |
| Interfamily Deed Transfer | -- | -- | |
| Interfamily Deed Transfer | -- | Land Title |
Mortgage History
| Date | Status | Loan Amount | Loan Type |
|---|---|---|---|
| Previous Owner | $40,000 | No Value Available |
Source: Las Vegas REALTORS®
MLS Number: 2730360
APN: 163-13-820-003
Disclaimer: Certain information contained herein is derived from information provided by parties other than Homes.com. All information provided is deemed reliable, but is not guaranteed to be accurate and should be independently verified.
![]() The data relating to real estate for sale on this web site comes in part from the INTERNET DATA EXCHANGE Program of the Greater Las Vegas Association of REALTORS® MLS. Real estate listings held by brokerage firms other than this site owner are marked with the IDX logo. Information is deemed reliable but not guaranteed. Copyright 2025 of the Greater Las Vegas Association of REALTORS® MLS. All rights reserved.
The data relating to real estate for sale on this web site comes in part from the INTERNET DATA EXCHANGE Program of the Greater Las Vegas Association of REALTORS® MLS. Real estate listings held by brokerage firms other than this site owner are marked with the IDX logo. Information is deemed reliable but not guaranteed. Copyright 2025 of the Greater Las Vegas Association of REALTORS® MLS. All rights reserved.
- 3941 Delos Dr Unit 3
- 3996 Tirana Way
- 3954 Delos Dr Unit 1
- 4015 Delos Dr
- 5220 Ganado Dr
- 4008 Spitze Dr
- 3851 Spitze Dr
- 4054 Crete Ln Unit C
- 3826 Spitze Dr
- 5162 Winston St
- 5422 Holbrook Dr
- 4795 Via San Andros
- 4150 Solteros St
- 3676 Hache St
- 4016 Calle Paula
- 3929 Calle Esquina
- 3610 Storrie Ct
- 3877 Platis Cir
- 5525 W Flamingo Rd Unit 1033
- 3930 Calle Esquina
- 3935 Tirana Way
- 3950 Delos Dr
- 3980 Delos Dr Unit 6
- 5315 Winston Dr
- 4201 S Decatur Blvd
- 3732 Spitze Dr
- 5198 Hibbetts Dr
- 4140 Solteros St Unit 3
- 4150 Solteros St Unit 1
- 4155 Solteros St Unit 2
- 4016 Calle Paula
- 5340 Retablo Ave Unit D
- 5267 Retablo Ave Unit C
- 5525 W Flamingo Rd Unit 2028
- 5525 W Flamingo Rd Unit 2025
- 4649 Via Torino
- 3625 S Decatur Blvd
- 5080 River Glen Dr Unit 189
- 5393 Retablo Ave
- 5152 River Glen Dr Unit 465
