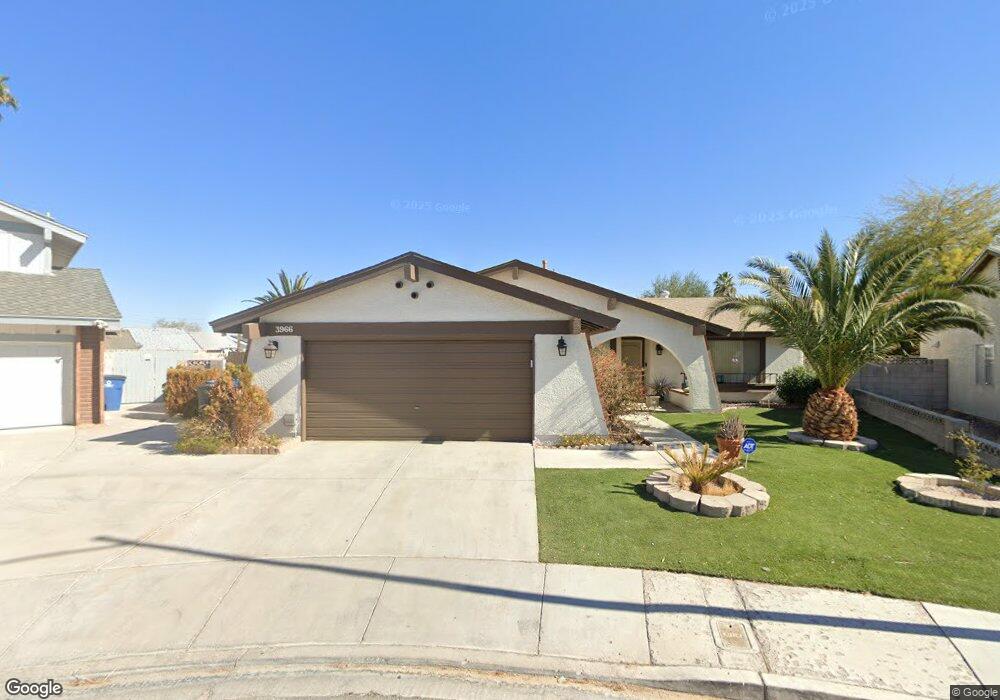
3966 Coolcrest Ct Las Vegas, NV 89103
Estimated Value: $454,000 - $537,000
3
Beds
2
Baths
1,722
Sq Ft
$285/Sq Ft
Est. Value
About This Home
This home is located at 3966 Coolcrest Ct, Las Vegas, NV 89103 and is currently estimated at $491,051, approximately $285 per square foot. 3966 Coolcrest Ct is a home located in Clark County with nearby schools including C H Decker Elementary School, Kenny C Guinn Middle School, and Ed W Clark High School.
Ownership History
Date
Name
Owned For
Owner Type
Purchase Details
Closed on
Feb 21, 2017
Sold by
Nouri Bruce and Nabavi Nouri Reybaneh
Bought by
Nabavi Nouri Reyhaneh
Current Estimated Value
Purchase Details
Closed on
Dec 5, 2014
Sold by
Nouri Bruce and Nabavi Nouri Sima
Bought by
Nouri Bruce and Nabavi Nouri Sima
Create a Home Valuation Report for This Property
The Home Valuation Report is an in-depth analysis detailing your home's value as well as a comparison with similar homes in the area
Home Values in the Area
Average Home Value in this Area
Purchase History
| Date | Buyer | Sale Price | Title Company |
|---|---|---|---|
| Nabavi Nouri Reyhaneh | -- | None Available | |
| Nouri Bruce | -- | None Available |
Source: Public Records
Tax History Compared to Growth
Tax History
| Year | Tax Paid | Tax Assessment Tax Assessment Total Assessment is a certain percentage of the fair market value that is determined by local assessors to be the total taxable value of land and additions on the property. | Land | Improvement |
|---|---|---|---|---|
| 2025 | $2,143 | $98,777 | $52,500 | $46,277 |
| 2024 | $1,985 | $98,777 | $52,500 | $46,277 |
| 2023 | $1,985 | $87,283 | $42,000 | $45,283 |
| 2022 | $1,838 | $77,176 | $35,000 | $42,176 |
| 2021 | $1,702 | $67,760 | $26,950 | $40,810 |
| 2020 | $1,578 | $67,344 | $26,250 | $41,094 |
| 2019 | $1,479 | $65,460 | $24,500 | $40,960 |
| 2018 | $1,411 | $61,158 | $21,000 | $40,158 |
| 2017 | $1,756 | $59,878 | $18,550 | $41,328 |
| 2016 | $1,322 | $57,871 | $15,750 | $42,121 |
| 2015 | $1,318 | $53,931 | $12,250 | $41,681 |
| 2014 | $1,277 | $51,133 | $10,500 | $40,633 |
Source: Public Records
Map
Nearby Homes
- 5728 Lucky Pagoda Ct
- 3871 Sauceda Ln
- 4068 Spitze Dr
- 4000 Camas Ct
- 5525 W Flamingo Rd Unit 1033
- 5525 W Flamingo Rd Unit 2030
- 5525 W Flamingo Rd Unit 2037
- 5873 Corazon Dr
- 4150 Solteros St
- 5944 Corazon Dr
- 5576 W Rochelle Ave Unit 27C
- 5576 W Rochelle Ave Unit 39A
- 5576 W Rochelle Ave Unit 9C
- 5576 W Rochelle Ave Unit 27A
- 5576 W Rochelle Ave Unit 13A
- 4274 Rollingstone Dr
- 3972 Tirana Way
- 3826 Edmond St
- 4015 Delos Dr
- 3947 Delos Dr
- 3954 Coolcrest Ct
- 3967 Keystone Ct
- 3978 Coolcrest Ct
- 3979 Keystone Ct
- 3955 Keystone Ct
- 3990 Coolcrest Ct
- 3955 Coolcrest Ct
- 3948 Norwich Cir
- 3991 Keystone Ct
- 3948 Platis Cir
- 3967 Coolcrest Ct
- 3979 Coolcrest Ct
- 3936 Platis Cir
- 3942 Norwich Cir
- 3954 Keystone Ct
- 3936 Norwich Cir
- 3991 Coolcrest Ct
- 3947 Norwich Cir
- 3978 Keystone Ct
- 3966 Keystone Ct