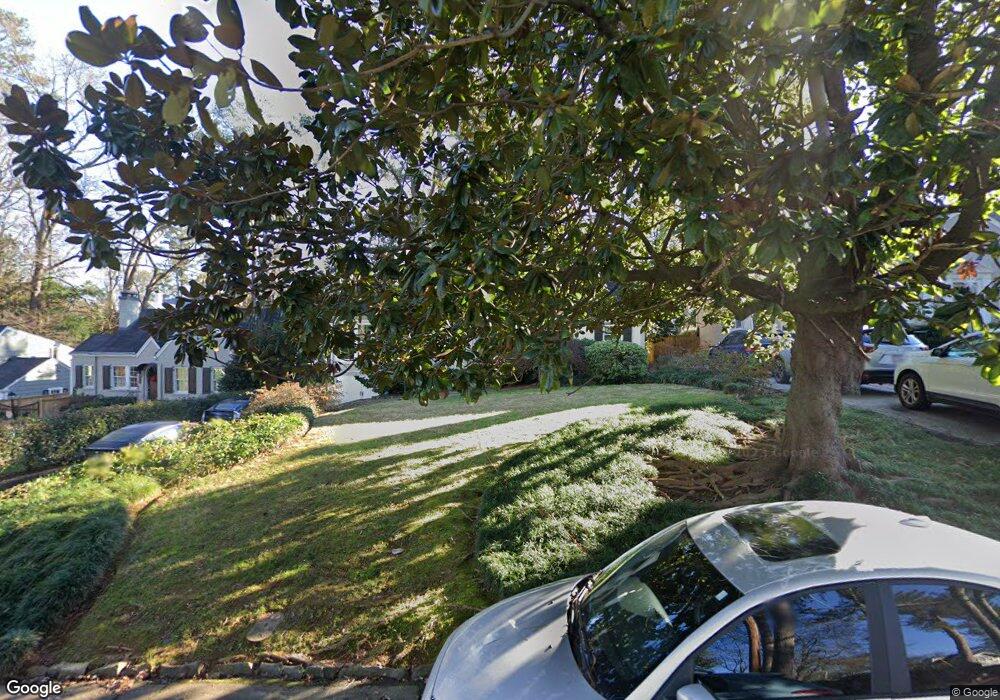
3967 Arden Way NE Atlanta, GA 30342
North Buckhead NeighborhoodEstimated Value: $880,000 - $1,038,000
2
Beds
2
Baths
1,927
Sq Ft
$480/Sq Ft
Est. Value
About This Home
This home is located at 3967 Arden Way NE, Atlanta, GA 30342 and is currently estimated at $924,845, approximately $479 per square foot. 3967 Arden Way NE is a home located in Fulton County with nearby schools including Smith Elementary School, Sutton Middle School, and North Atlanta High School.
Ownership History
Date
Name
Owned For
Owner Type
Purchase Details
Closed on
Aug 31, 2001
Sold by
Cronin Elizabeth W and Cronin Timothy C
Bought by
Frostig Randell B
Current Estimated Value
Home Financials for this Owner
Home Financials are based on the most recent Mortgage that was taken out on this home.
Original Mortgage
$382,750
Outstanding Balance
$149,578
Interest Rate
7.02%
Mortgage Type
New Conventional
Estimated Equity
$775,267
Purchase Details
Closed on
Nov 30, 1998
Sold by
Jowers Aj
Bought by
Cronin Elizabeth W and Cronin Timothy
Home Financials for this Owner
Home Financials are based on the most recent Mortgage that was taken out on this home.
Original Mortgage
$276,050
Interest Rate
6.9%
Mortgage Type
New Conventional
Create a Home Valuation Report for This Property
The Home Valuation Report is an in-depth analysis detailing your home's value as well as a comparison with similar homes in the area
Home Values in the Area
Average Home Value in this Area
Purchase History
| Date | Buyer | Sale Price | Title Company |
|---|---|---|---|
| Frostig Randell B | $425,300 | -- | |
| Cronin Elizabeth W | $256,800 | -- |
Source: Public Records
Mortgage History
| Date | Status | Borrower | Loan Amount |
|---|---|---|---|
| Open | Frostig Randell B | $382,750 | |
| Previous Owner | Cronin Elizabeth W | $276,050 |
Source: Public Records
Tax History Compared to Growth
Tax History
| Year | Tax Paid | Tax Assessment Tax Assessment Total Assessment is a certain percentage of the fair market value that is determined by local assessors to be the total taxable value of land and additions on the property. | Land | Improvement |
|---|---|---|---|---|
| 2025 | $8,396 | $337,960 | $173,440 | $164,520 |
| 2023 | $12,837 | $310,080 | $169,920 | $140,160 |
| 2022 | $7,671 | $253,360 | $116,760 | $136,600 |
| 2021 | $7,416 | $245,960 | $113,360 | $132,600 |
| 2020 | $7,062 | $230,120 | $97,160 | $132,960 |
| 2019 | $488 | $238,280 | $85,760 | $152,520 |
| 2018 | $7,831 | $232,000 | $78,720 | $153,280 |
| 2017 | $6,463 | $181,080 | $60,040 | $121,040 |
| 2016 | $6,456 | $181,080 | $60,040 | $121,040 |
| 2015 | $6,957 | $181,080 | $60,040 | $121,040 |
| 2014 | $6,711 | $181,080 | $60,040 | $121,040 |
Source: Public Records
Map
Nearby Homes
- 3958 N Stratford Rd NE
- 4005 N Stratford Rd NE
- 3891 Wieuca Rd NE
- 3928 Wieuca Rd NE
- 4000 Wieuca Rd NE
- 4036 Statewood Rd NE
- 4136 N Stratford Rd NE
- 821 Camden Park Ct NE
- 5114 N Ivy Rd NE
- 840 Camden Park Ct NE
- 906 Winall Down Rd NE
- 4084 Peachtree Dunwoody Rd NE
- 3939 Ivy Rd NE
- 3911 Ivy Rd NE
- 4097 Wieuca Rd NE
- 4065 Peachtree Dunwoody Rd NE
- 660 Old Ivy Rd NE
- 3975 Arden Way NE
- 3961 Arden Way NE
- 3979 Arden Way NE
- 3955 Arden Way NE
- 3972 N Stratford Rd NE
- 3985 Arden Way NE
- 3964 N Stratford Rd NE
- 3984 N Stratford Rd NE
- 726 Stovall Blvd NE
- 3990 N Stratford Rd NE
- 700 Stovall Blvd NE
- 3980 Arden Way NE
- 3996 N Stratford Rd NE
- 3950 N Stratford Rd NE
- 3998 N Stratford Rd NE
- 3946 N Stratford Rd NE
- 3984 Arden Way NE
- 705 Stovall Blvd NE
- 711 Stovall Blvd NE
- 699 Stovall Blvd NE