Estimated Value: $357,847 - $374,000
3
Beds
2
Baths
1,683
Sq Ft
$217/Sq Ft
Est. Value
About This Home
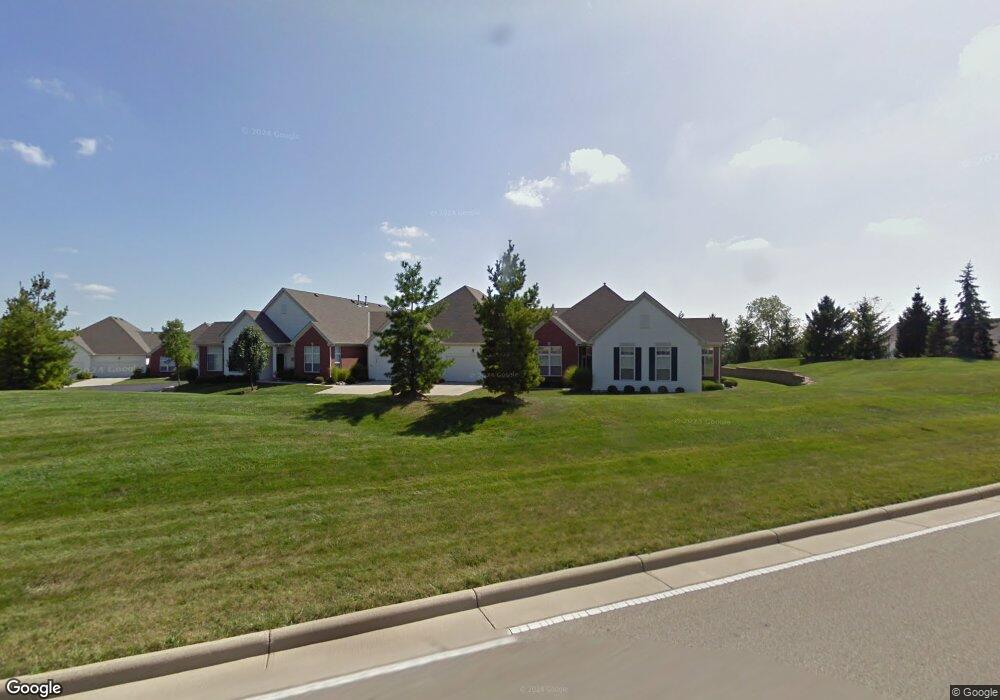
This home is located at 3967 Sandtrap Cir, Mason, OH 45040 and is currently estimated at $365,212, approximately $217 per square foot. 3967 Sandtrap Cir is a home located in Warren County with nearby schools including Mason Intermediate Elementary School, Mason Middle School, and William Mason High School.
Ownership History
Date
Name
Owned For
Owner Type
Purchase Details
Closed on
Jun 11, 2021
Sold by
Kunkel Robert C
Bought by
Kunkel Robert C and Yalim Derya B
Current Estimated Value
Home Financials for this Owner
Home Financials are based on the most recent Mortgage that was taken out on this home.
Original Mortgage
$175,000
Outstanding Balance
$158,441
Interest Rate
2.9%
Mortgage Type
Future Advance Clause Open End Mortgage
Estimated Equity
$206,771
Purchase Details
Closed on
May 19, 2009
Sold by
Altimier John E and Altimier Sally M
Bought by
Altimier John E and Altimier Mark A
Purchase Details
Closed on
Mar 12, 2001
Sold by
Barrington Inc
Bought by
Altimier John E and Altimier Sally M
Home Financials for this Owner
Home Financials are based on the most recent Mortgage that was taken out on this home.
Original Mortgage
$40,000
Interest Rate
7.18%
Mortgage Type
New Conventional
Create a Home Valuation Report for This Property
The Home Valuation Report is an in-depth analysis detailing your home's value as well as a comparison with similar homes in the area
Home Values in the Area
Average Home Value in this Area
Purchase History
| Date | Buyer | Sale Price | Title Company |
|---|---|---|---|
| Kunkel Robert C | -- | None Listed On Document | |
| Kunkel Robert C | $275,000 | American Homeland Title | |
| Altimier John E | -- | Attorney | |
| Altimier John E | $174,900 | -- |
Source: Public Records
Mortgage History
| Date | Status | Borrower | Loan Amount |
|---|---|---|---|
| Open | Kunkel Robert C | $175,000 | |
| Previous Owner | Altimier John E | $40,000 |
Source: Public Records
Tax History Compared to Growth
Tax History
| Year | Tax Paid | Tax Assessment Tax Assessment Total Assessment is a certain percentage of the fair market value that is determined by local assessors to be the total taxable value of land and additions on the property. | Land | Improvement |
|---|---|---|---|---|
| 2024 | $4,192 | $103,300 | $29,750 | $73,550 |
| 2023 | $3,707 | $77,154 | $14,455 | $62,699 |
| 2022 | $3,659 | $77,154 | $14,455 | $62,699 |
| 2021 | $3,546 | $77,154 | $14,455 | $62,699 |
| 2020 | $3,514 | $65,384 | $12,250 | $53,134 |
| 2019 | $3,239 | $65,384 | $12,250 | $53,134 |
| 2018 | $3,250 | $65,384 | $12,250 | $53,134 |
| 2017 | $2,871 | $53,911 | $10,266 | $43,645 |
| 2016 | $2,957 | $53,911 | $10,266 | $43,645 |
| 2015 | $2,963 | $53,911 | $10,266 | $43,645 |
| 2014 | $3,027 | $51,340 | $9,780 | $41,570 |
| 2013 | $2,446 | $64,340 | $12,250 | $52,090 |
Source: Public Records
Map
Nearby Homes
- 4087 Fieldsedge Dr Unit 285E
- 4154 Fieldsedge Dr
- 6668 Pondfield Ln
- 6309 Inverness Way
- 4109 Old Manchester Ct
- 6674 Villager Place Unit 153D
- 6415 Eagleview Dr
- 6416 Inverness Way
- 6441 Eagleview Dr
- 6486 Prestwick Ct
- 6572 Eagle View Dr
- 3900 St Andrews Ct
- 6550 Villagefield Dr
- 6521 Grand Cypress Way
- 711 Eagle View Ct
- 6394 Grand Cypress Way
- 6534 Turtle Point Place
- 5799 Fairway Dr
- 6545 Farmbrooke Ct
- 4427 Towneside Ct
- 3963 Sandtrap Cir
- 3965 Sandtrap Cir Unit 3965
- 3947 Sandtrap Cir Unit 3947
- 4320 Stitt Rd
- 4096 Fieldsedge Dr Unit 286B
- 3943 Sandtrap Cir
- 4098 Fieldsedge Dr
- 4094 Fieldsedge Dr Unit 286C
- 4092 Fieldsedge Dr
- 4090 Fieldsedge Dr
- 3949 Sandtrap Cir
- 4088 Fieldsedge Dr Unit 286F
- 4086 Fieldsedge Dr Unit 286G
- 4084 Fieldsedge Dr
- 3945 Sandtrap Cir Unit 3945
- 4116 Fieldsedge Dr Unit 287F
- 4118 Fieldsedge Dr
- 3907 Brantford Way Unit B3907
- 3907 Brantford Way Unit 1
- 3921 Sandtrap Cir