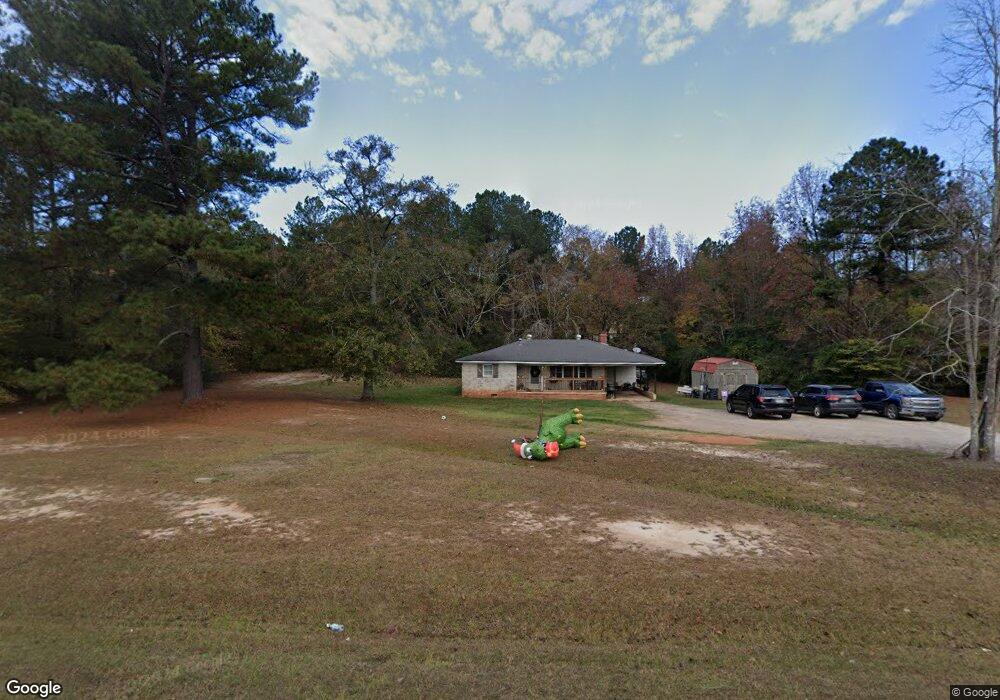
3968 Bartley Rd West Point, GA 31833
Estimated Value: $327,493 - $353,000
4
Beds
3
Baths
2,301
Sq Ft
$147/Sq Ft
Est. Value
About This Home
This home is located at 3968 Bartley Rd, West Point, GA 31833 and is currently estimated at $339,123, approximately $147 per square foot. 3968 Bartley Rd is a home located in Troup County with nearby schools including West Point Elementary School, Long Cane Elementary School, and Whitesville Road Elementary School.
Ownership History
Date
Name
Owned For
Owner Type
Purchase Details
Closed on
Jun 10, 2010
Sold by
Johns Leon
Bought by
Traylor Bobby L
Current Estimated Value
Home Financials for this Owner
Home Financials are based on the most recent Mortgage that was taken out on this home.
Original Mortgage
$138,750
Outstanding Balance
$92,716
Interest Rate
4.91%
Mortgage Type
New Conventional
Estimated Equity
$246,407
Purchase Details
Closed on
Apr 16, 2010
Sold by
Hsbc Mtg Svcs Inc
Bought by
Crook Jack M
Home Financials for this Owner
Home Financials are based on the most recent Mortgage that was taken out on this home.
Original Mortgage
$138,750
Outstanding Balance
$92,716
Interest Rate
4.91%
Mortgage Type
New Conventional
Estimated Equity
$246,407
Purchase Details
Closed on
Mar 2, 2010
Sold by
Bledsoe Timothy L
Bought by
Hsbc Mtg Svcs Inc
Purchase Details
Closed on
Jun 1, 2004
Sold by
Mary Michael and Mary Mccollum
Bought by
Bledsoe Timothy L
Create a Home Valuation Report for This Property
The Home Valuation Report is an in-depth analysis detailing your home's value as well as a comparison with similar homes in the area
Home Values in the Area
Average Home Value in this Area
Purchase History
| Date | Buyer | Sale Price | Title Company |
|---|---|---|---|
| Traylor Bobby L | $185,000 | -- | |
| Crook Jack M | $145,333 | -- | |
| Hsbc Mtg Svcs Inc | $148,511 | -- | |
| Hsbc Mtg Svcs Inc | $148,511 | -- | |
| Bledsoe Timothy L | $27,000 | -- |
Source: Public Records
Mortgage History
| Date | Status | Borrower | Loan Amount |
|---|---|---|---|
| Open | Hsbc Mtg Svcs Inc | $138,750 |
Source: Public Records
Tax History Compared to Growth
Tax History
| Year | Tax Paid | Tax Assessment Tax Assessment Total Assessment is a certain percentage of the fair market value that is determined by local assessors to be the total taxable value of land and additions on the property. | Land | Improvement |
|---|---|---|---|---|
| 2024 | $1,910 | $96,920 | $15,680 | $81,240 |
| 2023 | $1,922 | $97,360 | $15,680 | $81,680 |
| 2022 | $1,847 | $92,560 | $15,680 | $76,880 |
| 2021 | $1,615 | $80,040 | $15,680 | $64,360 |
| 2020 | $2,180 | $80,040 | $15,680 | $64,360 |
| 2019 | $2,386 | $79,120 | $15,680 | $63,440 |
| 2018 | $2,212 | $73,360 | $15,680 | $57,680 |
| 2017 | $2,213 | $73,360 | $15,680 | $57,680 |
| 2016 | $2,053 | $68,066 | $12,052 | $56,014 |
| 2015 | $2,056 | $68,066 | $12,052 | $56,014 |
| 2014 | $1,970 | $65,118 | $12,052 | $53,066 |
| 2013 | -- | $68,715 | $12,052 | $56,663 |
Source: Public Records
Map
Nearby Homes
- 4172 Bartley Rd
- 648 Warner Rd
- 333 Shoemaker Rd
- 208 Harris Walk Unit 80
- 0 Johns Rd Unit 10615130
- 0 Sandtown Rd Unit 10255987
- Sandtown Road Unit: 1 2+ - Acre
- 797 Gabbettville Rd
- 311 Tomme Rd
- 345 Robert Taylor Rd
- 0 Cannonville Rd
- 0 Robert Hayes Rd Unit 10611067
- 0 Lambert Rd
- 2067 Bartley Rd
- 143 W Drummond Rd
- 151 W Drummond Rd
- 157 W Drummond Rd
- 137 W Drummond Rd
- 131 W Drummond Rd
- 202 Reed Rd
- 3974 Bartley Rd
- 3978 Bartley Rd
- 3954 Bartley Rd
- 4008 Bartley Rd
- 4040 Bartley Rd
- 3973 Bartley Rd
- 4078 Bartley Rd
- 103 Amhurst Dr
- 3873 Bartley Rd
- 3850 Bartley Rd
- 105 Amhurst Dr
- 106 Amhurst Dr
- 107 Amhurst Dr
- 108 Amhurst Dr
- 109 Amhurst Dr Unit LOT 7
- 109 Amhurst Dr
- 110 Amhurst Dr
- 111 Amhurst Dr Unit LOT 8
- 111 Amhurst Dr
- 4131 Bartley Rd