Estimated Value: $410,000 - $465,000
4
Beds
2
Baths
1,762
Sq Ft
$246/Sq Ft
Est. Value
About This Home
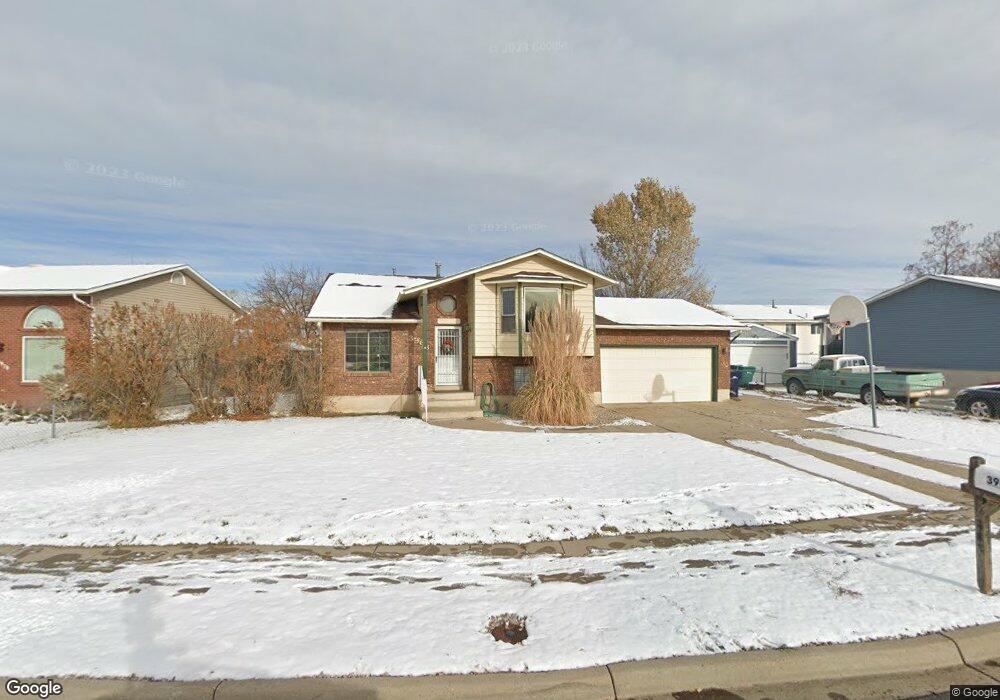
This home is located at 3968 W 5700 S, Roy, UT 84067 and is currently estimated at $432,641, approximately $245 per square foot. 3968 W 5700 S is a home located in Weber County with nearby schools including Freedom School, Roy Junior High School, and Roy High School.
Ownership History
Date
Name
Owned For
Owner Type
Purchase Details
Closed on
Jun 30, 2022
Sold by
Ramon And Shirly Maez Family Trust
Bought by
S & R Estates Llc
Current Estimated Value
Purchase Details
Closed on
Jul 11, 2019
Sold by
Maez Ramon A and Maez Shirley A
Bought by
Maez Ramon A and Maez Shirley L
Purchase Details
Closed on
Aug 16, 2018
Sold by
Maez Ramon Antonio and Broadhead Maez Shirley Lee
Bought by
S & R Estates Llc
Purchase Details
Closed on
Dec 9, 2016
Bought by
Maez Ramon A
Home Financials for this Owner
Home Financials are based on the most recent Mortgage that was taken out on this home.
Original Mortgage
$129,600
Interest Rate
4.13%
Create a Home Valuation Report for This Property
The Home Valuation Report is an in-depth analysis detailing your home's value as well as a comparison with similar homes in the area
Home Values in the Area
Average Home Value in this Area
Purchase History
| Date | Buyer | Sale Price | Title Company |
|---|---|---|---|
| S & R Estates Llc | -- | None Listed On Document | |
| Maez Ramon A | -- | None Available | |
| S & R Estates Llc | -- | None Available | |
| Maez Ramon A | -- | -- |
Source: Public Records
Mortgage History
| Date | Status | Borrower | Loan Amount |
|---|---|---|---|
| Previous Owner | Maez Ramon A | $129,600 | |
| Previous Owner | Maez Ramon A | -- |
Source: Public Records
Tax History Compared to Growth
Tax History
| Year | Tax Paid | Tax Assessment Tax Assessment Total Assessment is a certain percentage of the fair market value that is determined by local assessors to be the total taxable value of land and additions on the property. | Land | Improvement |
|---|---|---|---|---|
| 2025 | $2,329 | $412,658 | $135,000 | $277,658 |
| 2024 | $2,253 | $402,000 | $135,157 | $266,843 |
| 2023 | $2,159 | $386,000 | $120,046 | $265,954 |
| 2022 | $2,383 | $434,000 | $110,089 | $323,911 |
| 2021 | $1,799 | $299,000 | $80,077 | $218,923 |
| 2020 | $1,642 | $250,000 | $80,077 | $169,923 |
| 2019 | $1,704 | $245,000 | $45,098 | $199,902 |
| 2018 | $1,560 | $212,000 | $39,974 | $172,026 |
| 2017 | $1,483 | $190,000 | $39,974 | $150,026 |
| 2016 | $1,340 | $92,608 | $21,415 | $71,193 |
| 2015 | $575 | $81,910 | $21,415 | $60,495 |
| 2014 | $552 | $77,794 | $18,611 | $59,183 |
Source: Public Records
Map
Nearby Homes