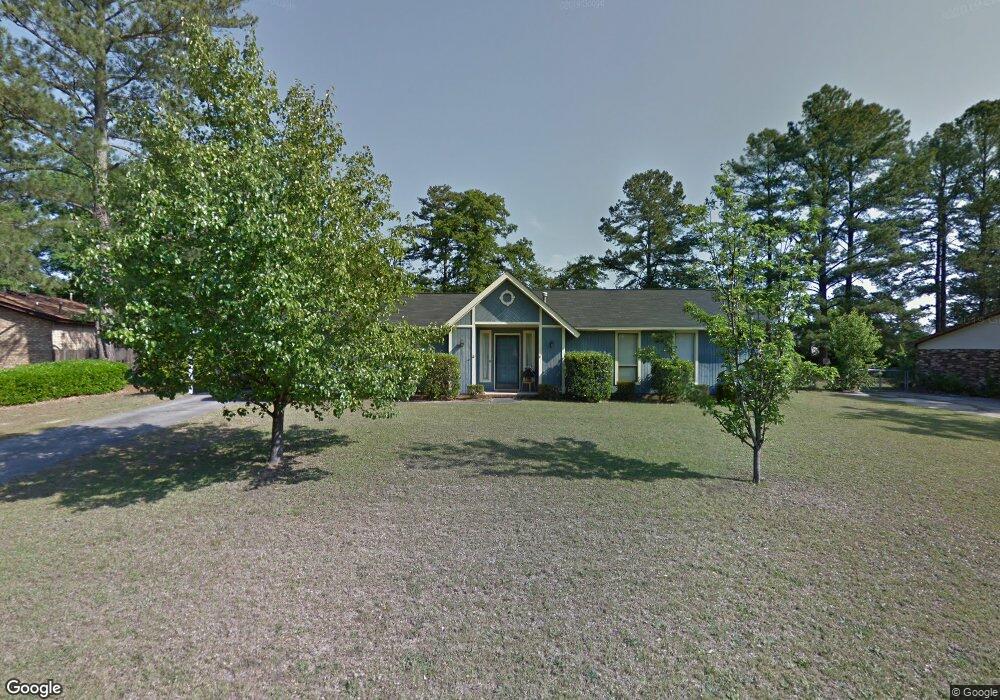
3969 Willowood Rd Augusta, GA 30907
Estimated Value: $205,000 - $228,000
3
Beds
2
Baths
1,527
Sq Ft
$143/Sq Ft
Est. Value
About This Home
This home is located at 3969 Willowood Rd, Augusta, GA 30907 and is currently estimated at $217,889, approximately $142 per square foot. 3969 Willowood Rd is a home located in Columbia County with nearby schools including Martinez Elementary School, Lakeside Middle School, and Lakeside High School.
Ownership History
Date
Name
Owned For
Owner Type
Purchase Details
Closed on
Jun 27, 2022
Sold by
Budwick Properties Llc
Bought by
Tovar Victor Martin and Rios Diana Noriega
Current Estimated Value
Home Financials for this Owner
Home Financials are based on the most recent Mortgage that was taken out on this home.
Original Mortgage
$195,000
Outstanding Balance
$185,266
Interest Rate
5.1%
Mortgage Type
New Conventional
Estimated Equity
$32,623
Purchase Details
Closed on
Apr 20, 2022
Sold by
Daxing J Llc
Bought by
Budwick Peter and Budwick Properties Llc
Purchase Details
Closed on
Feb 12, 2018
Sold by
Zhang Xi Ning
Bought by
Daxing J Llc
Purchase Details
Closed on
Aug 3, 2006
Sold by
Norman Jeanette P
Bought by
Zhang Xi Ning
Home Financials for this Owner
Home Financials are based on the most recent Mortgage that was taken out on this home.
Original Mortgage
$85,300
Interest Rate
6.71%
Mortgage Type
New Conventional
Create a Home Valuation Report for This Property
The Home Valuation Report is an in-depth analysis detailing your home's value as well as a comparison with similar homes in the area
Home Values in the Area
Average Home Value in this Area
Purchase History
| Date | Buyer | Sale Price | Title Company |
|---|---|---|---|
| Tovar Victor Martin | $205,000 | -- | |
| Budwick Peter | $186,000 | -- | |
| Daxing J Llc | -- | -- | |
| Zhang Xi Ning | $113,800 | -- |
Source: Public Records
Mortgage History
| Date | Status | Borrower | Loan Amount |
|---|---|---|---|
| Open | Tovar Victor Martin | $195,000 | |
| Previous Owner | Zhang Xi Ning | $85,300 |
Source: Public Records
Tax History
| Year | Tax Paid | Tax Assessment Tax Assessment Total Assessment is a certain percentage of the fair market value that is determined by local assessors to be the total taxable value of land and additions on the property. | Land | Improvement |
|---|---|---|---|---|
| 2025 | $1,901 | $77,246 | $17,004 | $60,242 |
| 2024 | $1,725 | $66,674 | $15,004 | $51,670 |
| 2023 | $1,725 | $71,347 | $14,504 | $56,843 |
| 2022 | $1,691 | $62,811 | $14,804 | $48,007 |
| 2021 | $1,587 | $56,212 | $11,604 | $44,608 |
| 2020 | $1,399 | $48,255 | $10,504 | $37,751 |
| 2019 | $1,346 | $46,357 | $10,104 | $36,253 |
| 2018 | $1,528 | $52,729 | $9,804 | $42,925 |
| 2017 | $1,286 | $43,873 | $8,704 | $35,169 |
| 2016 | $1,246 | $44,014 | $9,180 | $34,834 |
| 2015 | $1,169 | $41,082 | $8,180 | $32,902 |
| 2014 | $1,172 | $40,683 | $8,780 | $31,903 |
Source: Public Records
Map
Nearby Homes
- 262 Indian Creek Rd
- 4067 Flintrock Way
- 409 Old Anderson Rd
- 278 Maywood Dr
- 242 Maywood Dr
- 3987 Braddock St
- 416 Old Anderson Rd
- 3907 Willowood Rd
- 254 Hinman Dr
- 250 Hinman Dr
- 3924 Old Trail Rd
- 2818 Ferret Ct
- 3927 Mack Rd
- 255 Settlement Rd
- 4170 Heathcliff Dr
- 302 Summer Place
- 0 Settlement Rd
- 123 Lakeview Ct
- 4182 Knollcrest Cir N Unit N.
- 207 Caribe Dr
- 3967 Willowood Rd
- 3971 Willowood Rd
- 4060 Indian Creek Rd
- 3965 Willowood Rd
- 3968 Willowood Rd
- 3970 Willowood Rd
- 4058 Indian Creek Rd
- 3966 Willowood Rd
- 3963 Willowood Rd
- 3975 Willowood Rd
- 3974 Willowood Rd
- 3972 Willowood Rd
- 3964 Willowood Rd
- 4056 Indian Creek Rd
- 3961 Willowood Rd
- 3962 Willowood Rd
- 3976 Willowood Rd
- 278 Buckhead Rd
- 4059 Indian Creek Rd
- 3977 Willowood Rd
Your Personal Tour Guide
Ask me questions while you tour the home.