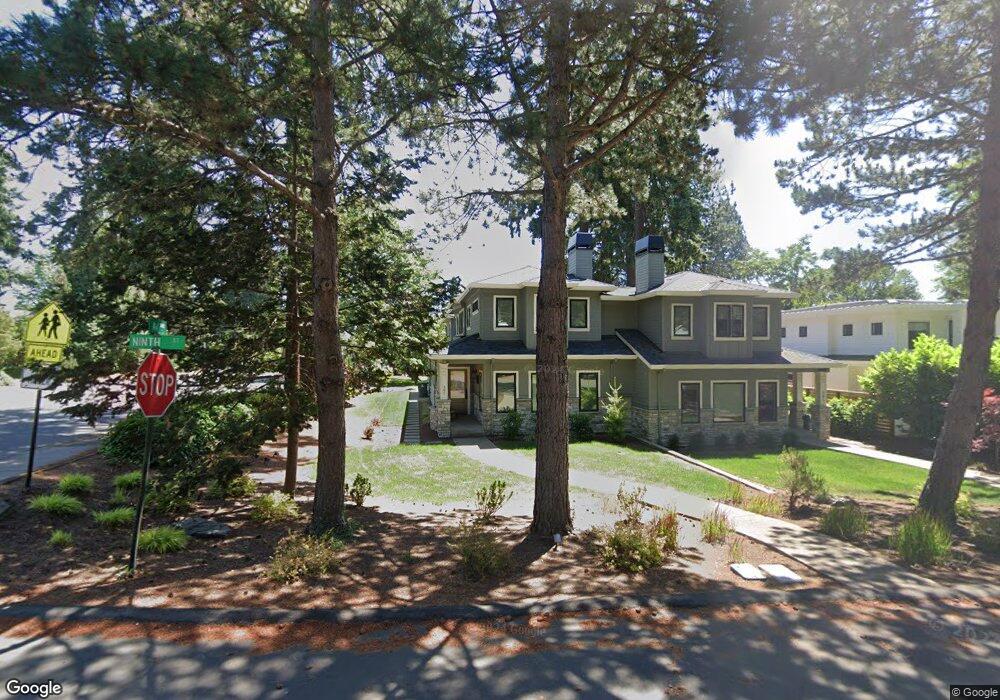
397 9th St Lake Oswego, OR 97034
Evergreen NeighborhoodEstimated Value: $1,343,000 - $1,785,000
4
Beds
3
Baths
2,100
Sq Ft
$752/Sq Ft
Est. Value
About This Home
This home is located at 397 9th St, Lake Oswego, OR 97034 and is currently estimated at $1,579,390, approximately $752 per square foot. 397 9th St is a home located in Clackamas County with nearby schools including Forest Hills Elementary School, Lake Oswego Junior High School, and Lake Oswego Senior High School.
Ownership History
Date
Name
Owned For
Owner Type
Purchase Details
Closed on
Feb 28, 2023
Sold by
Teal Point Custom Homes Llc
Bought by
Roderick Family Llc
Current Estimated Value
Purchase Details
Closed on
Jul 30, 2021
Sold by
Roderick Family Llc
Bought by
Teal Point Custom Homes Llc
Home Financials for this Owner
Home Financials are based on the most recent Mortgage that was taken out on this home.
Original Mortgage
$1,335,000
Interest Rate
3%
Mortgage Type
Commercial
Purchase Details
Closed on
Apr 26, 2018
Sold by
Elk Rock Capital Partners Inc
Bought by
Roderick Family Llc
Purchase Details
Closed on
Jan 15, 2018
Sold by
Kasem Surapon S and Kasem Susie
Bought by
Elk Rock Capital Parnters Inc
Create a Home Valuation Report for This Property
The Home Valuation Report is an in-depth analysis detailing your home's value as well as a comparison with similar homes in the area
Home Values in the Area
Average Home Value in this Area
Purchase History
| Date | Buyer | Sale Price | Title Company |
|---|---|---|---|
| Roderick Family Llc | -- | Fidelity National Title | |
| Teal Point Custom Homes Llc | -- | New Title Company Name | |
| Roderick Family Llc | $730,000 | Wfg Title | |
| Elk Rock Capital Parnters Inc | -- | Wfg Title |
Source: Public Records
Mortgage History
| Date | Status | Borrower | Loan Amount |
|---|---|---|---|
| Previous Owner | Teal Point Custom Homes Llc | $1,335,000 |
Source: Public Records
Tax History Compared to Growth
Tax History
| Year | Tax Paid | Tax Assessment Tax Assessment Total Assessment is a certain percentage of the fair market value that is determined by local assessors to be the total taxable value of land and additions on the property. | Land | Improvement |
|---|---|---|---|---|
| 2025 | $15,795 | $824,270 | -- | -- |
| 2024 | $15,374 | $800,263 | -- | -- |
| 2023 | $15,374 | $776,955 | $0 | $0 |
| 2022 | $9,538 | $496,913 | $0 | $0 |
| 2021 | $3,905 | $213,852 | $0 | $0 |
| 2020 | $2,363 | $128,876 | $0 | $0 |
| 2019 | $3,839 | $208,443 | $0 | $0 |
| 2018 | $6,041 | $334,831 | $0 | $0 |
| 2017 | $5,829 | $325,079 | $0 | $0 |
| 2016 | $5,306 | $315,611 | $0 | $0 |
| 2015 | $5,126 | $306,418 | $0 | $0 |
| 2014 | $5,060 | $297,493 | $0 | $0 |
Source: Public Records
Map
Nearby Homes