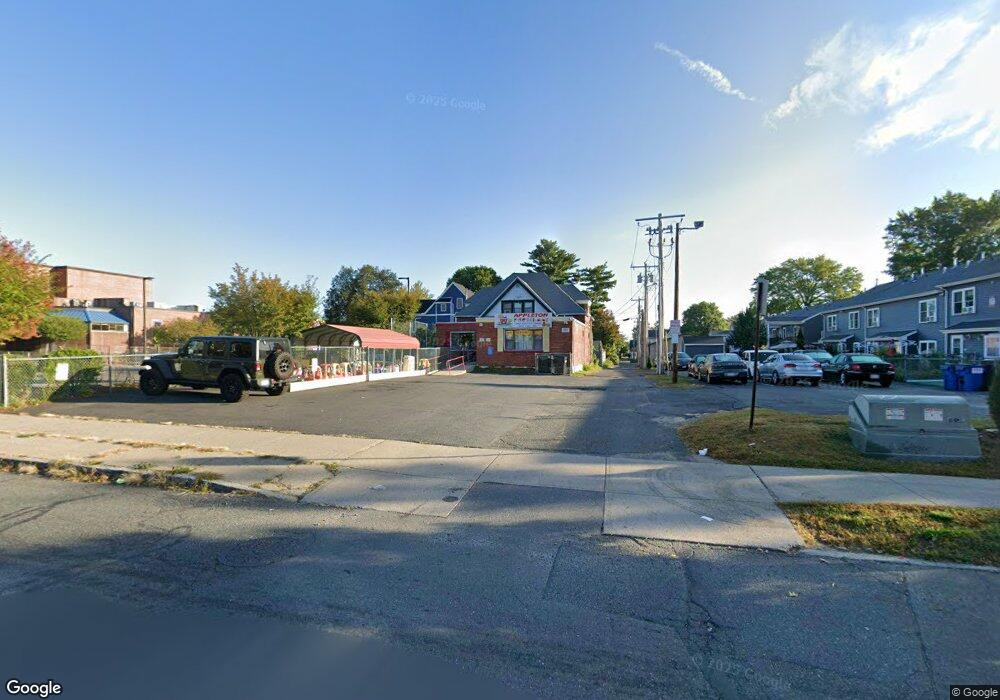
397 Appleton St Holyoke, MA 01040
Estimated Value: $176,128
Studio
2
Baths
2,296
Sq Ft
$77/Sq Ft
Est. Value
About This Home
This home is located at 397 Appleton St, Holyoke, MA 01040 and is currently estimated at $176,128, approximately $76 per square foot. 397 Appleton St is a home located in Hampden County with nearby schools including Kelly Elementary School, Lt. Clayre Sullivan Elementary School, and Holyoke High School.
Ownership History
Date
Name
Owned For
Owner Type
Purchase Details
Closed on
Jan 24, 2006
Sold by
Oconnell Francis P
Bought by
Zayas & Questell Llc and Questell
Current Estimated Value
Home Financials for this Owner
Home Financials are based on the most recent Mortgage that was taken out on this home.
Original Mortgage
$89,100
Outstanding Balance
$49,970
Interest Rate
6.33%
Mortgage Type
Commercial
Estimated Equity
$126,158
Purchase Details
Closed on
May 6, 2003
Sold by
Shea Ann T and Oconnell Francis P
Bought by
Oconnell Francis P
Purchase Details
Closed on
Nov 21, 1988
Sold by
Dorsett Wayne T
Bought by
Oconnell Francis P
Home Financials for this Owner
Home Financials are based on the most recent Mortgage that was taken out on this home.
Original Mortgage
$88,000
Interest Rate
10.28%
Mortgage Type
Commercial
Create a Home Valuation Report for This Property
The Home Valuation Report is an in-depth analysis detailing your home's value as well as a comparison with similar homes in the area
Home Values in the Area
Average Home Value in this Area
Purchase History
| Date | Buyer | Sale Price | Title Company |
|---|---|---|---|
| Zayas & Questell Llc | $99,000 | -- | |
| Zayas & Questell Llc | $99,000 | -- | |
| Oconnell Francis P | -- | -- | |
| Oconnell Francis P | -- | -- | |
| Oconnell Francis P | $110,000 | -- |
Source: Public Records
Mortgage History
| Date | Status | Borrower | Loan Amount |
|---|---|---|---|
| Open | Zayas & Questell Llc | $89,100 | |
| Closed | Oconnell Francis P | $89,100 | |
| Previous Owner | Oconnell Francis P | $144,300 | |
| Previous Owner | Oconnell Francis P | $88,000 |
Source: Public Records
Tax History
| Year | Tax Paid | Tax Assessment Tax Assessment Total Assessment is a certain percentage of the fair market value that is determined by local assessors to be the total taxable value of land and additions on the property. | Land | Improvement |
|---|---|---|---|---|
| 2025 | $6,045 | $156,800 | $25,000 | $131,800 |
| 2024 | $5,012 | $124,500 | $22,500 | $102,000 |
| 2023 | $5,001 | $124,500 | $22,500 | $102,000 |
| 2022 | $4,904 | $120,800 | $22,500 | $98,300 |
| 2021 | $4,681 | $115,200 | $22,500 | $92,700 |
| 2020 | $4,577 | $115,200 | $22,500 | $92,700 |
| 2019 | $4,520 | $113,400 | $20,500 | $92,900 |
| 2018 | $4,501 | $113,400 | $20,500 | $92,900 |
| 2017 | $4,504 | $113,400 | $20,500 | $92,900 |
| 2016 | $4,616 | $115,800 | $22,500 | $93,300 |
| 2015 | $4,624 | $115,800 | $22,500 | $93,300 |
Source: Public Records
Map
Nearby Homes
- 215 Elm St
- 225 Beech St Unit 227
- 219 Suffolk St
- 77 Newton St
- 49 Linden St
- 956 Dwight St
- 12 School St
- 13 Hampshire St
- 63 Pine St
- 329 Beech St
- 301-303 Linden St
- 15-17 Oconnor Ave
- 45 Saint Kolbe Dr Unit A
- 1137 Dwight St Unit C
- 201 Locust St
- 443-445 Beech St
- 141 Saint Jerome Ave
- 268-270 Sargeant St
- 199 Clemente St
- 1421 Dwight St
- 166 Pine St
- 164 Pine St
- 166-168 Pine St
- 378 Appleton St
- 160 Pine St
- 186 Pine St
- 179 Walnut St Unit 183
- 377 Appleton St
- 179 Pine St
- 190 Pine St
- 158 Pine St
- 156 Pine St
- 156 Pine St Unit 1
- 185 Pine St
- 198 Pine St
- 186 Walnut St
- 186 Walnut St Unit 1
- 186 Walnut St Unit 2
- 191 Walnut St
- 191 Walnut St Unit 3