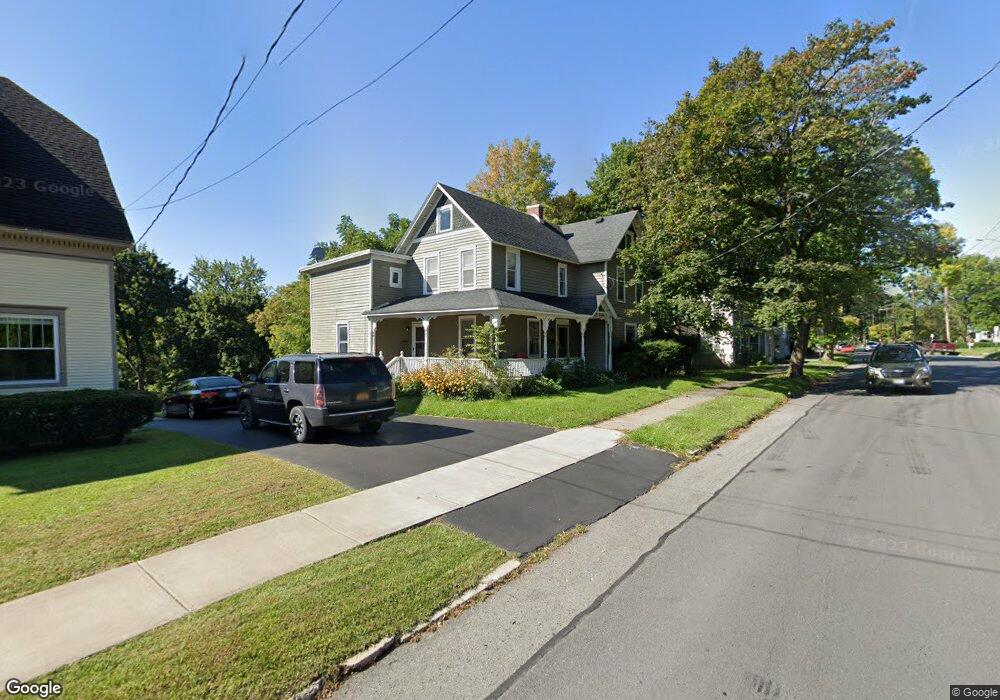
397 Castle St Geneva, NY 14456
Estimated Value: $166,000 - $227,000
4
Beds
1
Bath
1,777
Sq Ft
$110/Sq Ft
Est. Value
About This Home
This home is located at 397 Castle St, Geneva, NY 14456 and is currently estimated at $196,068, approximately $110 per square foot. 397 Castle St is a home located in Ontario County with nearby schools including West Street Elementary School, North Street Elementary School, and Geneva Middle School.
Ownership History
Date
Name
Owned For
Owner Type
Purchase Details
Closed on
Jun 19, 2006
Sold by
Hogan Gregory Mark Sharon S
Bought by
Schwarze Andrew
Current Estimated Value
Home Financials for this Owner
Home Financials are based on the most recent Mortgage that was taken out on this home.
Original Mortgage
$110,000
Outstanding Balance
$30,611
Interest Rate
6.62%
Estimated Equity
$165,457
Create a Home Valuation Report for This Property
The Home Valuation Report is an in-depth analysis detailing your home's value as well as a comparison with similar homes in the area
Home Values in the Area
Average Home Value in this Area
Purchase History
We collect this data history from publicly available records. To have your information removed, we recommend requesting removal directly through your county’s website.
| Date | Buyer | Sale Price | Title Company |
|---|---|---|---|
| Schwarze Andrew | $110,000 | Albert Kusak |
Source: Public Records
Mortgage History
We collect this data history from publicly available records. To have your information removed, we recommend requesting removal directly through your county’s website.
| Date | Status | Borrower | Loan Amount |
|---|---|---|---|
| Open | Schwarze Andrew | $110,000 |
Source: Public Records
Tax History
| Year | Tax Paid | Tax Assessment Tax Assessment Total Assessment is a certain percentage of the fair market value that is determined by local assessors to be the total taxable value of land and additions on the property. | Land | Improvement |
|---|---|---|---|---|
| 2025 | $5,189 | $151,600 | $11,000 | $140,600 |
| 2024 | $5,189 | $151,600 | $11,000 | $140,600 |
| 2023 | $5,339 | $111,500 | $11,000 | $100,500 |
| 2022 | $5,045 | $111,500 | $11,000 | $100,500 |
| 2021 | $4,967 | $111,500 | $11,000 | $100,500 |
| 2020 | $2,341 | $111,500 | $11,000 | $100,500 |
| 2019 | $0 | $93,500 | $8,400 | $85,100 |
| 2018 | $2,126 | $93,500 | $8,400 | $85,100 |
| 2017 | $2,039 | $93,500 | $8,400 | $85,100 |
| 2016 | $2,036 | $93,500 | $8,400 | $85,100 |
| 2015 | -- | $101,400 | $8,400 | $93,000 |
| 2014 | -- | $101,400 | $8,400 | $93,000 |
Source: Public Records
Map
Nearby Homes
Your Personal Tour Guide
Ask me questions while you tour the home.