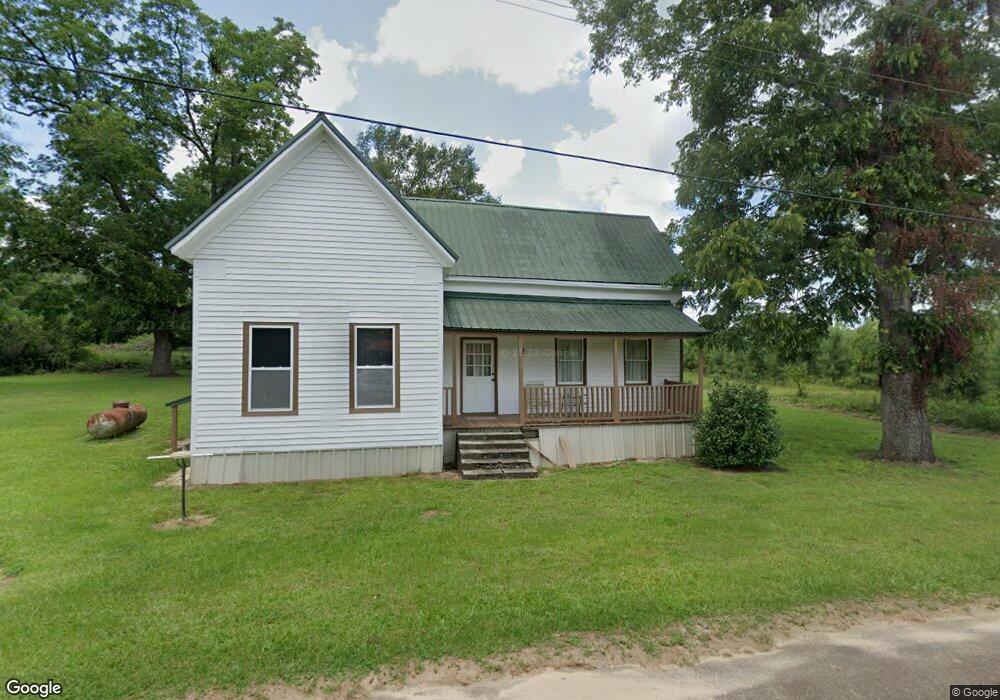
397 Chestnut St Coleman, GA 39836
Estimated Value: $52,518 - $231,000
--
Bed
1
Bath
1,279
Sq Ft
$102/Sq Ft
Est. Value
About This Home
This home is located at 397 Chestnut St, Coleman, GA 39836 and is currently estimated at $130,880, approximately $102 per square foot. 397 Chestnut St is a home located in Randolph County with nearby schools including Randolph County Elementary School, Randolph Clay Middle School, and Randolph Clay High School.
Ownership History
Date
Name
Owned For
Owner Type
Purchase Details
Closed on
Apr 2, 2024
Sold by
Whatley Bonnie Gail
Bought by
Whatley Dave Edmond
Current Estimated Value
Purchase Details
Closed on
Nov 1, 2000
Sold by
Whatley Dave Edmond
Bought by
Whatley Bonnie Gail
Purchase Details
Closed on
Feb 10, 1995
Bought by
Whatley Dave Edmond
Purchase Details
Closed on
Mar 21, 1990
Bought by
Whatley Charles and Whatley G
Create a Home Valuation Report for This Property
The Home Valuation Report is an in-depth analysis detailing your home's value as well as a comparison with similar homes in the area
Home Values in the Area
Average Home Value in this Area
Purchase History
| Date | Buyer | Sale Price | Title Company |
|---|---|---|---|
| Whatley Dave Edmond | -- | -- | |
| Whatley Bonnie Gail | -- | -- | |
| Whatley Bonnie Gail | -- | -- | |
| Whatley Dave Edmond | -- | -- | |
| Whatley Dave Edmond | -- | -- | |
| Whatley Charles | $6,000 | -- | |
| Whatley Charles | $6,000 | -- |
Source: Public Records
Tax History Compared to Growth
Tax History
| Year | Tax Paid | Tax Assessment Tax Assessment Total Assessment is a certain percentage of the fair market value that is determined by local assessors to be the total taxable value of land and additions on the property. | Land | Improvement |
|---|---|---|---|---|
| 2024 | $429 | $15,584 | $1,640 | $13,944 |
| 2023 | $248 | $15,584 | $1,640 | $13,944 |
| 2022 | $248 | $15,584 | $1,640 | $13,944 |
| 2021 | $143 | $9,823 | $1,467 | $8,356 |
| 2020 | $153 | $9,823 | $1,467 | $8,356 |
| 2019 | $153 | $9,823 | $1,467 | $8,356 |
| 2018 | $347 | $9,823 | $1,467 | $8,356 |
| 2017 | $281 | $9,823 | $1,467 | $8,356 |
| 2016 | $282 | $9,822 | $1,467 | $8,356 |
| 2015 | -- | $9,822 | $1,467 | $8,356 |
| 2014 | -- | $7,854 | $1,467 | $6,387 |
| 2013 | -- | $7,853 | $1,466 | $6,386 |
Source: Public Records
Map
Nearby Homes
- 3016 Clubhouse Rd
- 229 +-ac Cty Rd 62 Cty Rd 160 (Morgan Rd)
- 0 County Rd 70
- TBD Bethel Rd
- 24346 U S 27
- 24333 U S 27
- 0 Edison Hwy
- 867 Coleman Rd
- 15 Holanna Spur
- 396 Hood St
- 0 Days Ave
- Lot 15 & 16 Hidden Lagoon Estates
- County Line Rd Lot Unit WP001
- 886 Mounds Rd
- 349 Highland Ave
- 365 Highland Ave
- 242 Lumpkin St
- 697 Lumpkin St
- 220 Fair Rd
- 0 District Line Rd Unit 10518137