Estimated Value: $360,289 - $466,000
Studio
--
Bath
1,279
Sq Ft
$317/Sq Ft
Est. Value
About This Home
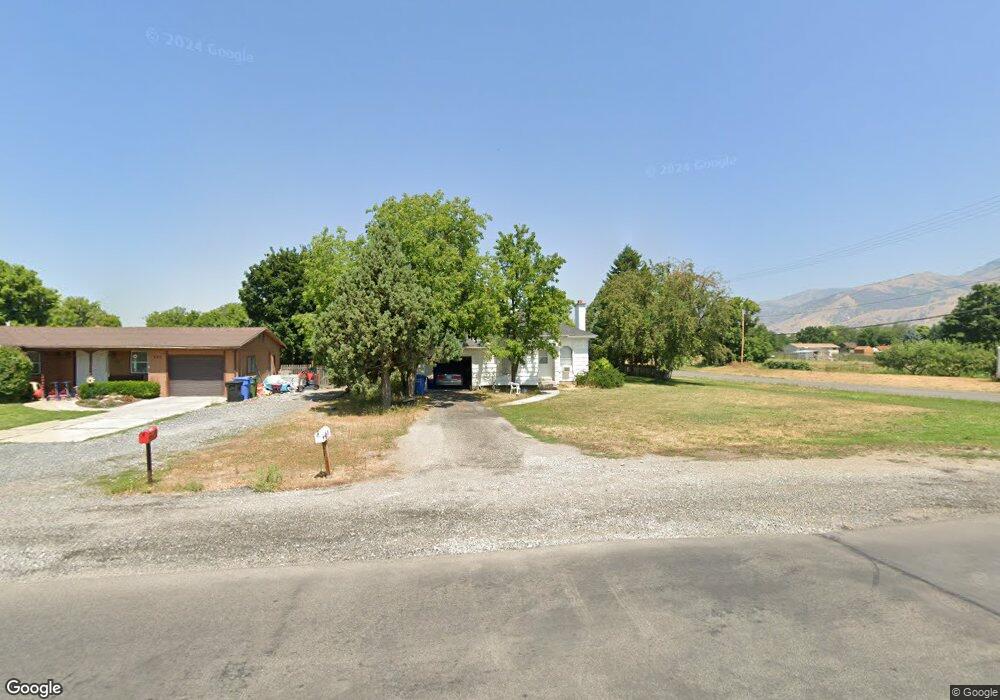
This home is located at 397 E 300 S, Hyrum, UT 84319 and is currently estimated at $405,072, approximately $316 per square foot. 397 E 300 S is a home with nearby schools including Lincoln School, South Cache Middle School, and Mountain Crest High School.
Ownership History
Date
Name
Owned For
Owner Type
Purchase Details
Closed on
Mar 24, 2020
Sold by
Harward Thomas Orin and Bair Angi Harward
Bought by
Hot Investments Llc
Current Estimated Value
Purchase Details
Closed on
Feb 14, 2007
Sold by
Fulton Sonja K
Bought by
Harward Valerie
Home Financials for this Owner
Home Financials are based on the most recent Mortgage that was taken out on this home.
Original Mortgage
$89,250
Interest Rate
9.7%
Mortgage Type
Adjustable Rate Mortgage/ARM
Create a Home Valuation Report for This Property
The Home Valuation Report is an in-depth analysis detailing your home's value as well as a comparison with similar homes in the area
Home Values in the Area
Average Home Value in this Area
Purchase History
| Date | Buyer | Sale Price | Title Company |
|---|---|---|---|
| Hot Investments Llc | -- | Accommodation | |
| Harward Valerie | -- | Northern Title Company |
Source: Public Records
Mortgage History
| Date | Status | Borrower | Loan Amount |
|---|---|---|---|
| Previous Owner | Harward Valerie | $89,250 |
Source: Public Records
Tax History
| Year | Tax Paid | Tax Assessment Tax Assessment Total Assessment is a certain percentage of the fair market value that is determined by local assessors to be the total taxable value of land and additions on the property. | Land | Improvement |
|---|---|---|---|---|
| 2025 | $1,315 | $188,850 | $0 | $0 |
| 2023 | $2,167 | $277,855 | $0 | $0 |
| 2022 | $2,456 | $301,680 | $0 | $0 |
| 2021 | $2,248 | $234,070 | $65,050 | $169,020 |
| 2020 | $1,997 | $195,066 | $65,050 | $130,016 |
| 2019 | $1,020 | $170,366 | $42,350 | $128,016 |
| 2018 | $970 | $156,650 | $42,350 | $114,300 |
| 2017 | $851 | $71,310 | $0 | $0 |
| 2016 | $870 | $71,310 | $0 | $0 |
| 2015 | $872 | $71,310 | $0 | $0 |
| 2014 | $853 | $71,310 | $0 | $0 |
| 2013 | -- | $71,310 | $0 | $0 |
Source: Public Records
Map
Nearby Homes
Your Personal Tour Guide
Ask me questions while you tour the home.