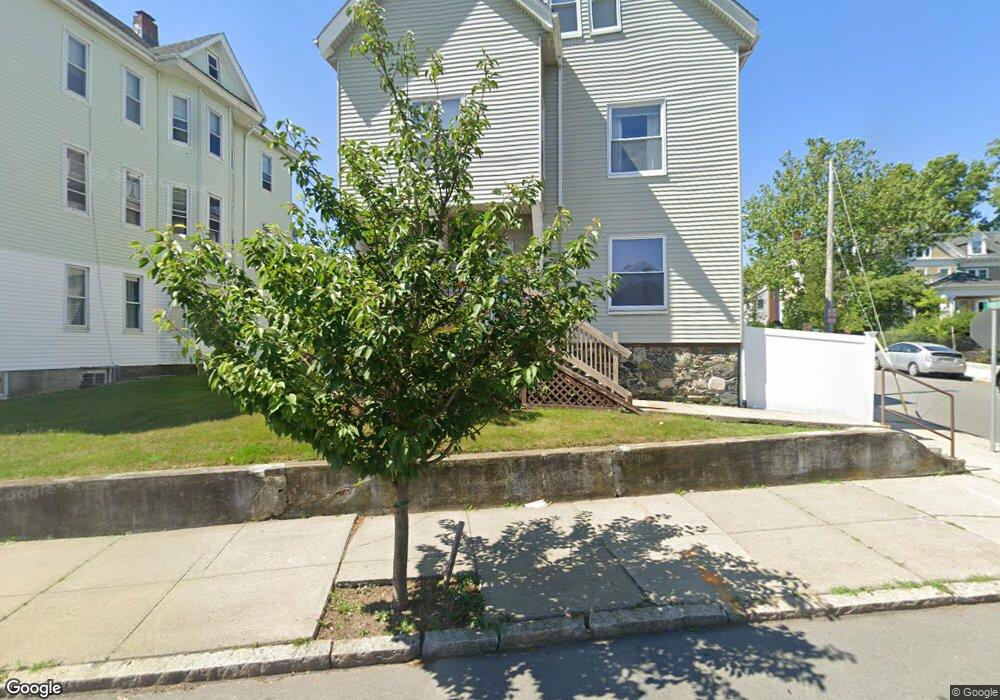
397 Ferry St Unit 1 Malden, MA 02148
Belmont NeighborhoodEstimated Value: $393,000 - $463,000
2
Beds
1
Bath
850
Sq Ft
$512/Sq Ft
Est. Value
About This Home
This home is located at 397 Ferry St Unit 1, Malden, MA 02148 and is currently estimated at $434,904, approximately $511 per square foot. 397 Ferry St Unit 1 is a home located in Middlesex County with nearby schools including Malden High School, Cheverus Catholic School, and Malden Catholic.
Ownership History
Date
Name
Owned For
Owner Type
Purchase Details
Closed on
Nov 13, 2009
Sold by
Obrien Michael and Shamir Esther
Bought by
Moura John
Current Estimated Value
Home Financials for this Owner
Home Financials are based on the most recent Mortgage that was taken out on this home.
Original Mortgage
$220,850
Outstanding Balance
$144,059
Interest Rate
4.98%
Mortgage Type
Purchase Money Mortgage
Estimated Equity
$290,845
Purchase Details
Closed on
Jul 13, 2005
Sold by
Minassian Kamer and Minassian Shakkay
Bought by
Shamir Esther
Home Financials for this Owner
Home Financials are based on the most recent Mortgage that was taken out on this home.
Original Mortgage
$198,400
Interest Rate
5.67%
Mortgage Type
Purchase Money Mortgage
Purchase Details
Closed on
Apr 12, 2005
Sold by
Minassian Kamer and Minassian Shakkay
Bought by
Minassian Kamer
Home Financials for this Owner
Home Financials are based on the most recent Mortgage that was taken out on this home.
Original Mortgage
$234,000
Interest Rate
5.7%
Mortgage Type
Purchase Money Mortgage
Create a Home Valuation Report for This Property
The Home Valuation Report is an in-depth analysis detailing your home's value as well as a comparison with similar homes in the area
Home Values in the Area
Average Home Value in this Area
Purchase History
| Date | Buyer | Sale Price | Title Company |
|---|---|---|---|
| Moura John | $232,500 | -- | |
| Shamir Esther | $248,000 | -- | |
| Minassian Kamer | -- | -- |
Source: Public Records
Mortgage History
| Date | Status | Borrower | Loan Amount |
|---|---|---|---|
| Open | Moura John | $220,850 | |
| Previous Owner | Shamir Esther | $198,400 | |
| Previous Owner | Minassian Kamer | $234,000 |
Source: Public Records
Tax History Compared to Growth
Tax History
| Year | Tax Paid | Tax Assessment Tax Assessment Total Assessment is a certain percentage of the fair market value that is determined by local assessors to be the total taxable value of land and additions on the property. | Land | Improvement |
|---|---|---|---|---|
| 2025 | $42 | $370,900 | $0 | $370,900 |
| 2024 | $4,047 | $346,200 | $0 | $346,200 |
| 2023 | $3,845 | $315,400 | $0 | $315,400 |
| 2022 | $3,299 | $267,100 | $0 | $267,100 |
| 2021 | $3,194 | $259,900 | $0 | $259,900 |
| 2020 | $3,226 | $255,000 | $0 | $255,000 |
| 2019 | $3,052 | $230,000 | $0 | $230,000 |
| 2018 | $3,052 | $216,600 | $0 | $216,600 |
| 2017 | $2,840 | $200,400 | $0 | $200,400 |
| 2016 | $3,369 | $222,200 | $0 | $222,200 |
| 2015 | $3,248 | $206,500 | $0 | $206,500 |
| 2014 | $3,325 | $206,500 | $0 | $206,500 |
Source: Public Records
Map
Nearby Homes
- 16 Boylston St
- 13-15 Benner Ave
- 23 Upham St
- 23 Pratt St
- 272-274 Cross St Unit 1
- 272-274 Cross St Unit 4
- 272-274 Cross St Unit 3
- 272-274 Cross St Unit 5
- 272-274 Cross St Unit 2
- 17 Ashton St
- 44 Stevens St
- 72 Ashland St Unit 307
- 17 Garland Ave
- 210 Hancock St
- 89 Judson St
- 55 Clarendon St
- 32 Central Ave
- 4 Cross St Unit 1
- 15-17 Barrett St
- 98 Bradford St
- 397 Ferry St Unit 3
- 397 Ferry St Unit 2
- 405 Ferry St Unit 3
- 403 Ferry St Unit 405
- 25 Parker St
- 398 Ferry St
- 409 Ferry St Unit 2
- 409 Ferry St Unit 1
- 409 Ferry St
- 409 Ferry St Unit 3
- 00 Boylston St
- 406 Ferry St
- 392 Ferry St Unit a
- 7 Boylston St Unit 2
- 7 Boylston St Unit 3
- 7 Boylston St
- 392 Ferry St Unit 1
- 415 Ferry St
- 21 Parker St
- 388 Ferry St